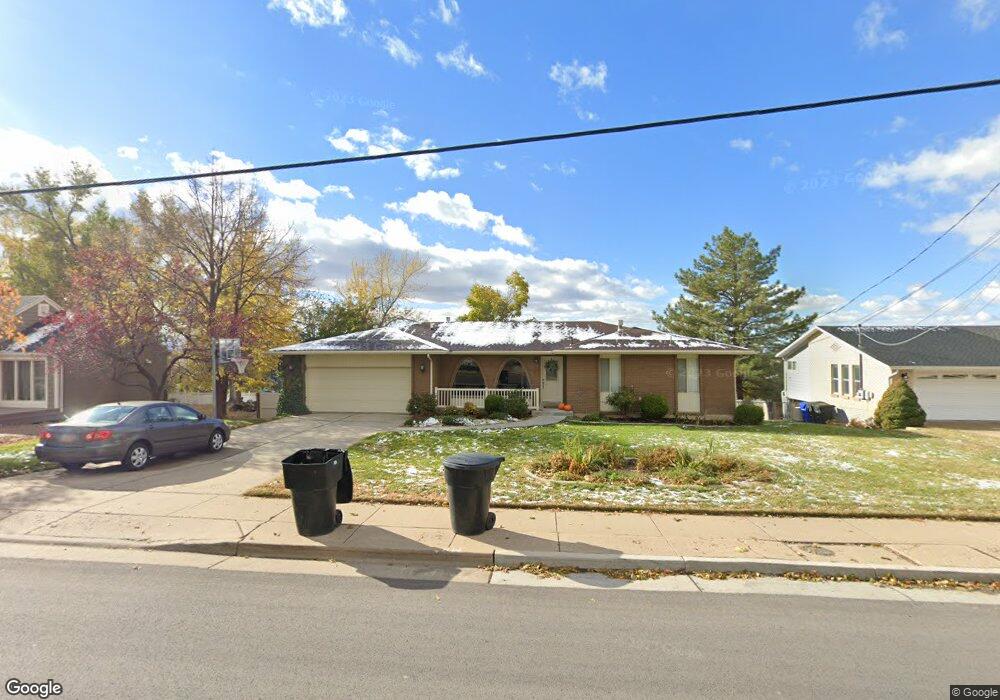
585 N 400 E Centerville, UT 84014
Estimated Value: $475,000 - $672,000
5
Beds
2
Baths
1,676
Sq Ft
$351/Sq Ft
Est. Value
About This Home
This home is located at 585 N 400 E, Centerville, UT 84014 and is currently estimated at $587,622, approximately $350 per square foot. 585 N 400 E is a home located in Davis County with nearby schools including Centerville Elementary, Centerville Jr High, and Viewmont High School.
Ownership History
Date
Name
Owned For
Owner Type
Purchase Details
Closed on
Mar 31, 2000
Sold by
Broom Joseph L and Broom Jean H
Bought by
Rapp Robert S and Rapp Jill A
Current Estimated Value
Home Financials for this Owner
Home Financials are based on the most recent Mortgage that was taken out on this home.
Original Mortgage
$205,000
Outstanding Balance
$69,927
Interest Rate
8.38%
Estimated Equity
$517,695
Purchase Details
Closed on
Feb 10, 1999
Sold by
Smoot Stanley M and Smoot Mary Ellen
Bought by
Broom Joseph L and Broom Jean H
Home Financials for this Owner
Home Financials are based on the most recent Mortgage that was taken out on this home.
Original Mortgage
$187,500
Interest Rate
6.77%
Purchase Details
Closed on
Jun 30, 1997
Sold by
Essig Lester K and Essig Shauna S
Bought by
Smoot Stanley M and Smoot Mary Ellen
Create a Home Valuation Report for This Property
The Home Valuation Report is an in-depth analysis detailing your home's value as well as a comparison with similar homes in the area
Purchase History
| Date | Buyer | Sale Price | Title Company |
|---|---|---|---|
| Rapp Robert S | -- | Associated Title Company | |
| Broom Joseph L | -- | Associated Title Company | |
| Smoot Stanley M | -- | Associated Title Company |
Source: Public Records
Mortgage History
| Date | Status | Borrower | Loan Amount |
|---|---|---|---|
| Open | Rapp Robert S | $205,000 | |
| Previous Owner | Broom Joseph L | $187,500 |
Source: Public Records
Tax History
| Year | Tax Paid | Tax Assessment Tax Assessment Total Assessment is a certain percentage of the fair market value that is determined by local assessors to be the total taxable value of land and additions on the property. | Land | Improvement |
|---|---|---|---|---|
| 2025 | $3,387 | $323,950 | $184,954 | $138,996 |
| 2024 | $3,345 | $311,850 | $171,810 | $140,040 |
| 2023 | $3,091 | $519,000 | $274,491 | $244,509 |
| 2022 | $3,119 | $301,950 | $140,086 | $161,864 |
| 2021 | $2,875 | $421,000 | $222,252 | $198,748 |
| 2020 | $2,769 | $379,000 | $212,786 | $166,214 |
| 2019 | $2,540 | $374,000 | $199,430 | $174,570 |
| 2018 | $2,372 | $345,000 | $184,316 | $160,684 |
| 2016 | $2,000 | $161,700 | $69,894 | $91,806 |
| 2015 | $1,954 | $149,050 | $69,894 | $79,156 |
| 2014 | $1,701 | $132,743 | $69,894 | $62,849 |
| 2013 | -- | $135,175 | $48,336 | $86,839 |
Source: Public Records
Map
Nearby Homes
- 295 E 500 N
- 563 N 220 E
- 380 E 400 N
- 252 N 400 E
- 984 N 500 E
- 66 Brookside Ln
- 775 Pheasantbrook Cir
- 360 E Center St
- 56 W 200 N
- 16 S 200 E
- 328 E 1100 S
- 132 W 200 N
- 282 W 605 N Unit A
- 282 W 605 N Unit I
- 281 W 650 N Unit B
- 292 W 680 N
- 303 W 650 N Unit I
- 781 Pheasantbrook Dr
- 1290 Oakridge Dr
- 88 W 50 S Unit C-3
Your Personal Tour Guide
Ask me questions while you tour the home.