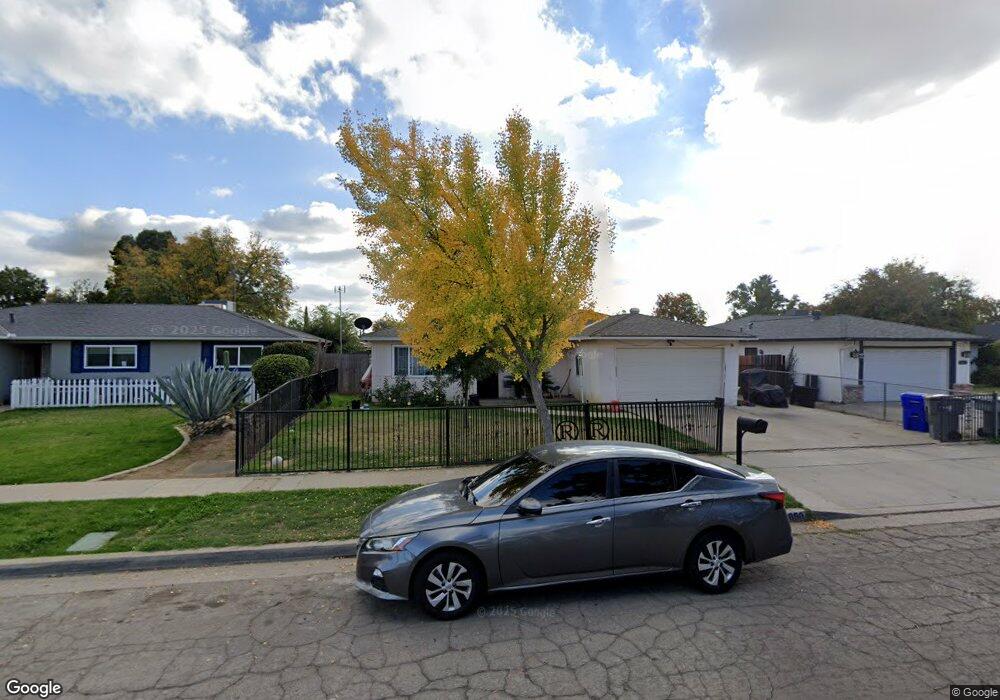
5850 E Lansing Way Fresno, CA 93727
McLane NeighborhoodEstimated Value: $322,820 - $391,000
3
Beds
2
Baths
1,204
Sq Ft
$297/Sq Ft
Est. Value
About This Home
This home is located at 5850 E Lansing Way, Fresno, CA 93727 and is currently estimated at $357,955, approximately $297 per square foot. 5850 E Lansing Way is a home located in Fresno County with nearby schools including Tomahawk School, Miramonte Elementary School, and Reyburn Intermediate School.
Ownership History
Date
Name
Owned For
Owner Type
Purchase Details
Closed on
Jan 14, 2011
Sold by
Federal Home Loan Mortgage Corporation
Bought by
Lara Criselda
Current Estimated Value
Home Financials for this Owner
Home Financials are based on the most recent Mortgage that was taken out on this home.
Original Mortgage
$77,770
Interest Rate
4.9%
Mortgage Type
FHA
Purchase Details
Closed on
Mar 16, 2010
Sold by
Ayala Phillip V and Ayala Darlene S
Bought by
Federal Home Loan Mortgage Corporation
Purchase Details
Closed on
Jun 12, 2001
Sold by
Zebb Fred
Bought by
Ayala Phillip and Ayala Darlene S
Home Financials for this Owner
Home Financials are based on the most recent Mortgage that was taken out on this home.
Original Mortgage
$91,185
Interest Rate
7.14%
Mortgage Type
FHA
Create a Home Valuation Report for This Property
The Home Valuation Report is an in-depth analysis detailing your home's value as well as a comparison with similar homes in the area
Home Values in the Area
Average Home Value in this Area
Purchase History
| Date | Buyer | Sale Price | Title Company |
|---|---|---|---|
| Lara Criselda | $114,500 | Ticor Title Riverside | |
| Federal Home Loan Mortgage Corporation | $110,000 | Accommodation | |
| Ayala Phillip | $92,000 | First American Title Co |
Source: Public Records
Mortgage History
| Date | Status | Borrower | Loan Amount |
|---|---|---|---|
| Previous Owner | Lara Criselda | $77,770 | |
| Previous Owner | Ayala Phillip | $91,185 |
Source: Public Records
Tax History Compared to Growth
Tax History
| Year | Tax Paid | Tax Assessment Tax Assessment Total Assessment is a certain percentage of the fair market value that is determined by local assessors to be the total taxable value of land and additions on the property. | Land | Improvement |
|---|---|---|---|---|
| 2025 | $1,708 | $146,683 | $43,939 | $102,744 |
| 2023 | $1,640 | $140,989 | $42,234 | $98,755 |
| 2022 | $1,617 | $138,225 | $41,406 | $96,819 |
| 2021 | $1,570 | $135,516 | $40,595 | $94,921 |
| 2020 | $1,563 | $134,127 | $40,179 | $93,948 |
| 2019 | $1,531 | $131,498 | $39,392 | $92,106 |
| 2018 | $1,497 | $128,920 | $38,620 | $90,300 |
| 2017 | $1,470 | $126,393 | $37,863 | $88,530 |
| 2016 | $1,419 | $123,916 | $37,121 | $86,795 |
| 2015 | $1,396 | $122,056 | $36,564 | $85,492 |
| 2014 | $1,369 | $119,666 | $35,848 | $83,818 |
Source: Public Records
Map
Nearby Homes
- 3556 N Duke Ave Unit 165
- 3556 N Duke Ave Unit 175
- 3550 N Duke Ave Unit 37
- 3550 N Duke Ave Unit 10
- 3550 N Duke Ave Unit 12
- 5936 E Lansing Way
- 5934 E Dakota Ave
- 3734 Manila Ave
- 3624 Eddy Ave
- 3605 Phillip Ave
- 6402 E Millie Dr
- 3322 N Ezie Ave
- 6008 E Sussex Way
- 5739 E Hampton Way
- 4065 N Eddy Ave
- 5965 E Shields Ave Unit 178
- 5703 E Hampton Way
- 6157 E Garland Ave
- 5675 E Ashlan Ave
- 6165 E Farrin Ave
- 5854 E Lansing Way
- 5846 E Lansing Way
- 5849 E Dakota Ave
- 5845 E Dakota Ave
- 5853 E Dakota Ave
- 5858 E Lansing Way
- 5840 E Lansing Way
- 5839 E Dakota Ave
- 5857 E Dakota Ave
- 5847 E Lansing Way
- 5855 E Lansing Way
- 5864 E Lansing Way
- 5836 E Lansing Way
- 5841 E Lansing Way
- 5859 E Lansing Way
- 5835 E Dakota Ave
- 5865 E Dakota Ave
- 5832 E Lansing Way
- 5837 E Lansing Way