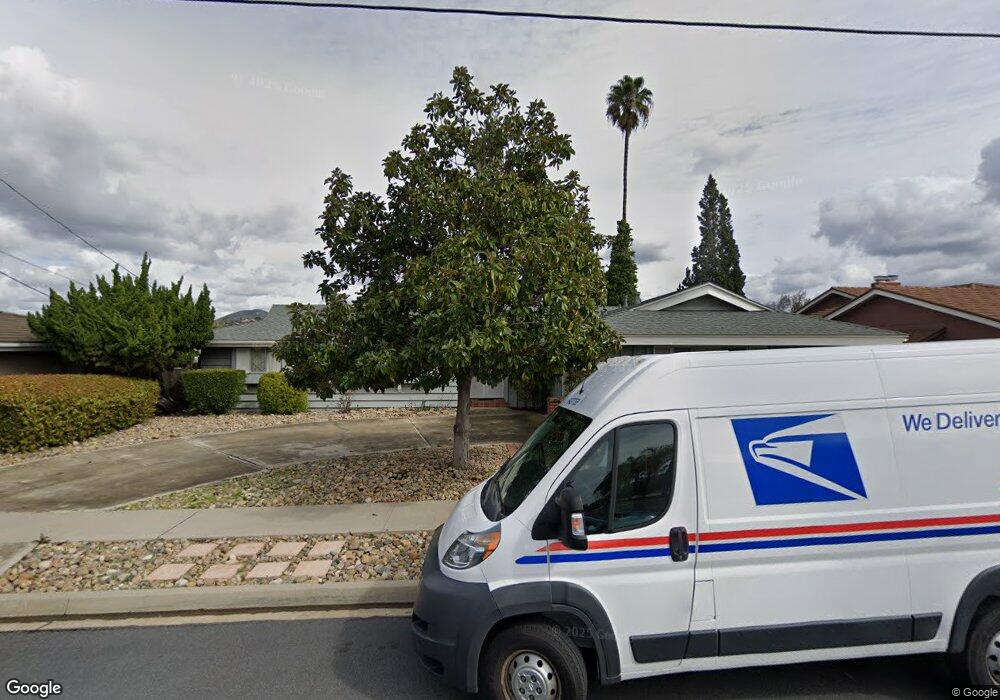
5851 Hampton Ct San Diego, CA 92120
Del Cerro NeighborhoodEstimated Value: $1,366,000 - $1,644,000
4
Beds
3
Baths
2,500
Sq Ft
$598/Sq Ft
Est. Value
About This Home
This home is located at 5851 Hampton Ct, San Diego, CA 92120 and is currently estimated at $1,495,385, approximately $598 per square foot. 5851 Hampton Ct is a home located in San Diego County with nearby schools including Hearst Elementary School, Lewis Middle School, and Patrick Henry High School.
Ownership History
Date
Name
Owned For
Owner Type
Purchase Details
Closed on
Mar 26, 2019
Sold by
Forbes Family Marital Trust
Bought by
Flach Fryson Living Trust
Current Estimated Value
Home Financials for this Owner
Home Financials are based on the most recent Mortgage that was taken out on this home.
Original Mortgage
$632,000
Outstanding Balance
$553,360
Interest Rate
4.2%
Mortgage Type
New Conventional
Estimated Equity
$942,025
Purchase Details
Closed on
Jul 11, 2013
Sold by
Forbes Jeanne C
Bought by
Forbes Jeanne C and Rondestvedt Cheryl Ann
Purchase Details
Closed on
Oct 28, 2004
Sold by
Forbes George T and Forbes Jeanne C
Bought by
Forbes George T and Forbes Jeanne C
Home Financials for this Owner
Home Financials are based on the most recent Mortgage that was taken out on this home.
Original Mortgage
$250,000
Interest Rate
5.74%
Mortgage Type
Credit Line Revolving
Create a Home Valuation Report for This Property
The Home Valuation Report is an in-depth analysis detailing your home's value as well as a comparison with similar homes in the area
Home Values in the Area
Average Home Value in this Area
Purchase History
| Date | Buyer | Sale Price | Title Company |
|---|---|---|---|
| Flach Fryson Living Trust | $790,000 | Ticor Title San Diego Branch | |
| Forbes Jeanne C | -- | None Available | |
| Forbes George T | -- | Southland Title Of San Diego | |
| Forbes George T | -- | Southland Title |
Source: Public Records
Mortgage History
| Date | Status | Borrower | Loan Amount |
|---|---|---|---|
| Open | Flach Fryson Living Trust | $632,000 | |
| Previous Owner | Forbes George T | $250,000 |
Source: Public Records
Tax History Compared to Growth
Tax History
| Year | Tax Paid | Tax Assessment Tax Assessment Total Assessment is a certain percentage of the fair market value that is determined by local assessors to be the total taxable value of land and additions on the property. | Land | Improvement |
|---|---|---|---|---|
| 2025 | $10,559 | $881,255 | $624,688 | $256,567 |
| 2024 | $10,559 | $863,977 | $612,440 | $251,537 |
| 2023 | $10,325 | $847,037 | $600,432 | $246,605 |
| 2022 | $10,049 | $830,429 | $588,659 | $241,770 |
| 2021 | $9,978 | $814,147 | $577,117 | $237,030 |
| 2020 | $9,857 | $805,800 | $571,200 | $234,600 |
| 2019 | $1,334 | $105,578 | $27,934 | $77,644 |
| 2018 | $1,166 | $103,509 | $27,387 | $76,122 |
| 2017 | $1,137 | $101,480 | $26,850 | $74,630 |
| 2016 | $1,116 | $99,491 | $26,324 | $73,167 |
| 2015 | $1,098 | $97,997 | $25,929 | $72,068 |
| 2014 | $1,081 | $96,079 | $25,422 | $70,657 |
Source: Public Records
Map
Nearby Homes
- 6543 Carthage St
- 6016 Wenrich Place
- 6817 Birchwood St
- 5513 Adobe Falls Rd Unit 11
- 6549 Glenroy St
- 6196 Rockhurst Dr
- 6183 Rockhurst Dr
- 5432 Adobe Falls Rd Unit 12
- 5996 College Ave
- 6329 Caminito Estrellado
- 5957 Caminito de la Taza
- 6391 Estrella Ave
- 6342 Lambda Dr
- 5468 Princess View Place
- 6221 Brynwood Ct
- 7137 Keighley St
- 6182 Loukelton Cir
- 5701 Madra Ave
- 5873 Madra Ave
- 5125 Fontaine St Unit 105
- 5841 Hampton Ct
- 5861 Hampton Ct
- 5831 Hampton Ct
- 5871 Hampton Ct
- 5840 Hampton Ct
- 5860 Hampton Ct
- 5821 Hampton Ct
- 5830 Hampton Ct
- 5845 Kent Place
- 5844 Kent Place
- 5575 Cambria Ct
- 5820 Hampton Ct
- 5592 Cambria Ct
- 5811 Hampton Ct
- 5834 Malvern Ct
- 5835 Kent Place
- 5834 Kent Place
- 5565 Cambria Ct
- 5844 Malvern Ct
- 5824 Malvern Ct