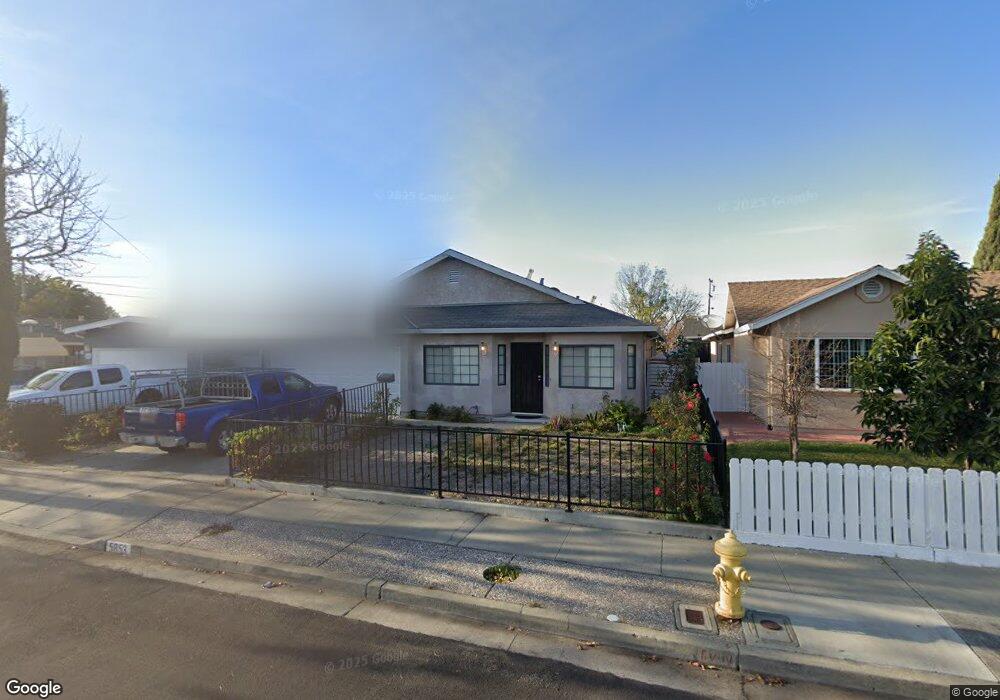
5853 Biddle Ave Newark, CA 94560
Estimated Value: $944,000 - $1,138,000
3
Beds
2
Baths
1,149
Sq Ft
$911/Sq Ft
Est. Value
About This Home
This home is located at 5853 Biddle Ave, Newark, CA 94560 and is currently estimated at $1,046,818, approximately $911 per square foot. 5853 Biddle Ave is a home located in Alameda County with nearby schools including Newark Junior High School, Newark Memorial High School, and St. Edward School.
Ownership History
Date
Name
Owned For
Owner Type
Purchase Details
Closed on
Jun 26, 2019
Sold by
Montanez Conrado and Arechiga Carmen
Bought by
Hong Warren W and Deng Xiaohui
Current Estimated Value
Home Financials for this Owner
Home Financials are based on the most recent Mortgage that was taken out on this home.
Original Mortgage
$400,000
Outstanding Balance
$351,722
Interest Rate
4%
Mortgage Type
New Conventional
Estimated Equity
$695,096
Purchase Details
Closed on
Jul 18, 1994
Sold by
Temple Patricia Susanne and Sills Patricia Susanne
Bought by
Montanez Conrado and Arechiga Carmen
Home Financials for this Owner
Home Financials are based on the most recent Mortgage that was taken out on this home.
Original Mortgage
$140,400
Interest Rate
8.25%
Create a Home Valuation Report for This Property
The Home Valuation Report is an in-depth analysis detailing your home's value as well as a comparison with similar homes in the area
Home Values in the Area
Average Home Value in this Area
Purchase History
| Date | Buyer | Sale Price | Title Company |
|---|---|---|---|
| Hong Warren W | $700,000 | First American Title Company | |
| Montanez Conrado | $156,000 | Old Republic Title Company | |
| Temple Patricia Susanne | -- | Old Republic Title Company |
Source: Public Records
Mortgage History
| Date | Status | Borrower | Loan Amount |
|---|---|---|---|
| Open | Hong Warren W | $400,000 | |
| Previous Owner | Montanez Conrado | $140,400 |
Source: Public Records
Tax History
| Year | Tax Paid | Tax Assessment Tax Assessment Total Assessment is a certain percentage of the fair market value that is determined by local assessors to be the total taxable value of land and additions on the property. | Land | Improvement |
|---|---|---|---|---|
| 2025 | $9,414 | $765,540 | $300,748 | $464,792 |
| 2024 | $9,414 | $750,532 | $294,852 | $455,680 |
| 2023 | $9,163 | $735,818 | $289,071 | $446,747 |
| 2022 | $9,051 | $721,392 | $283,404 | $437,988 |
| 2021 | $8,825 | $707,252 | $277,849 | $429,403 |
| 2020 | $8,718 | $700,000 | $275,000 | $425,000 |
| 2019 | $3,393 | $249,201 | $70,466 | $178,735 |
| 2018 | $3,337 | $244,316 | $69,085 | $175,231 |
| 2017 | $3,251 | $239,526 | $67,730 | $171,796 |
| 2016 | $3,204 | $234,831 | $66,403 | $168,428 |
| 2015 | $3,191 | $231,304 | $65,405 | $165,899 |
| 2014 | $3,099 | $226,774 | $64,124 | $162,650 |
Source: Public Records
Map
Nearby Homes
- 36465 Hafner St
- 36605 Hafner St
- 36637 Burdick St
- 6190 Bellhaven Place
- 36188 Fig Tree Ln
- 6328 Zulmida Ave
- 35926 Newark Blvd
- 6169 Thornton Ave Unit B
- 5311 Port Sailwood Dr
- 36276 Sandalwood St
- 6364 Noel Ave
- 5298 Sussex Place
- 37141 Saint Christopher St
- 5228 Falmouth Place
- 35442 Breton Dr
- 6241 Cotton Ave
- 36563 Beutke Dr
- 36569 Beutke Dr
- 36103 Chelsea Dr
- 36184 Toulouse St
- 5841 Biddle Ave
- 5865 Biddle Ave
- 36460 Hafner St
- 5829 Biddle Ave
- 36470 Hafner St
- 5864 Hafner Way
- 36448 Hafner St
- 5852 Biddle Ave
- 5817 Biddle Ave
- 5848 Hafner Way
- 5840 Biddle Ave
- 5864 Biddle Ave
- 5828 Biddle Ave
- 5876 Biddle Ave
- 5805 Biddle Ave
- 5830 Hafner Way
- 5816 Biddle Ave
- 5888 Biddle Ave
- 36473 Hafner St
- 36457 Hafner St
Your Personal Tour Guide
Ask me questions while you tour the home.