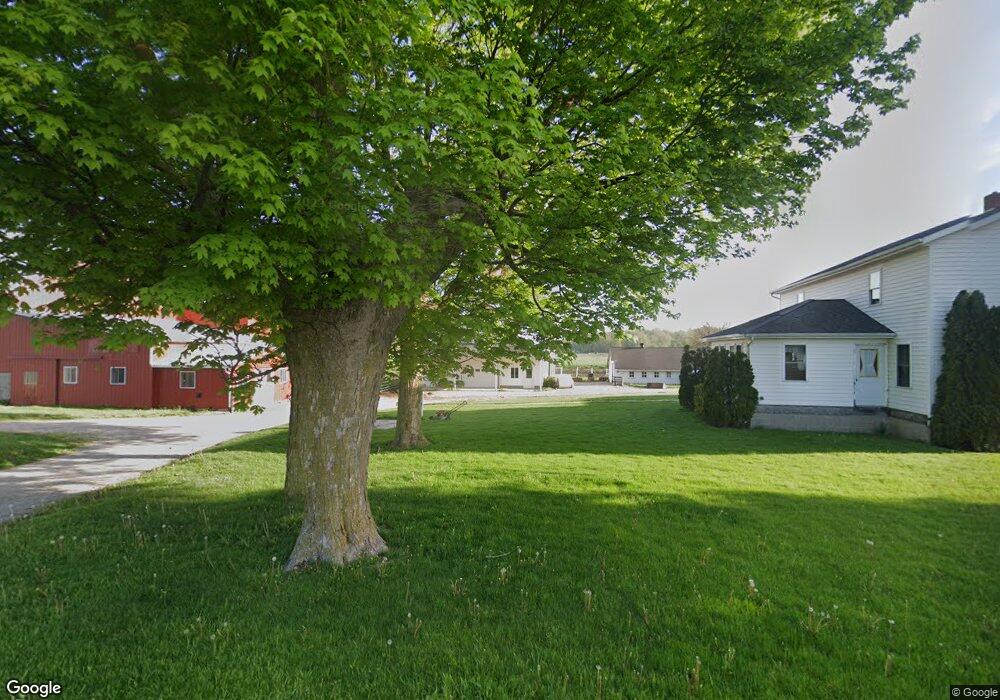
5855 W 100 S Topeka, IN 46571
Estimated Value: $270,000 - $882,013
5
Beds
2
Baths
2,840
Sq Ft
$207/Sq Ft
Est. Value
About This Home
This home is located at 5855 W 100 S, Topeka, IN 46571 and is currently estimated at $588,004, approximately $207 per square foot. 5855 W 100 S is a home located in LaGrange County with nearby schools including Shipshewana-Scott Elementary School, Westview Elementary School, and Westview Junior/Senior High School.
Ownership History
Date
Name
Owned For
Owner Type
Purchase Details
Closed on
Dec 2, 2013
Sold by
Mishler Family Revocable Livin
Bought by
Mishler Dewayne E and Mishler Regina R
Current Estimated Value
Purchase Details
Closed on
Aug 26, 2009
Sold by
Tri County Land Trustee Corporation
Bought by
Sara Dewayne E and Sara Etta Mishler
Create a Home Valuation Report for This Property
The Home Valuation Report is an in-depth analysis detailing your home's value as well as a comparison with similar homes in the area
Home Values in the Area
Average Home Value in this Area
Purchase History
| Date | Buyer | Sale Price | Title Company |
|---|---|---|---|
| Mishler Dewayne E | $245,500 | Lakeland Title Co | |
| Sara Dewayne E | $78,000 | Farm Credit Services |
Source: Public Records
Tax History Compared to Growth
Tax History
| Year | Tax Paid | Tax Assessment Tax Assessment Total Assessment is a certain percentage of the fair market value that is determined by local assessors to be the total taxable value of land and additions on the property. | Land | Improvement |
|---|---|---|---|---|
| 2024 | $5,065 | $605,300 | $176,300 | $429,000 |
| 2023 | $4,959 | $607,000 | $151,900 | $455,100 |
| 2022 | $4,568 | $555,100 | $122,500 | $432,600 |
| 2021 | $3,240 | $402,500 | $106,700 | $295,800 |
| 2020 | $3,306 | $397,100 | $106,100 | $291,000 |
| 2019 | $3,505 | $413,900 | $124,000 | $289,900 |
| 2018 | $3,450 | $397,700 | $127,200 | $270,500 |
| 2017 | $3,595 | $420,200 | $141,400 | $278,800 |
| 2016 | $3,645 | $418,600 | $143,200 | $275,400 |
| 2014 | $3,043 | $352,400 | $133,900 | $218,500 |
| 2013 | $3,043 | $341,300 | $120,300 | $221,000 |
Source: Public Records
Map
Nearby Homes
- 7260 W 350 N
- 365 Country Ln
- 7820 W 350 N
- 1575 W 195 N
- 522 N Main St
- 310 Todd St
- 429 Jay St
- 423 Jay St
- 3295 N 980 W
- 218 N Main St
- 317 E Lake St
- 0 Corner of Factory St & Townline Rd Unit 202541800
- 217 N Sherman St
- 4720 N State Road 5
- 245 E 100 S
- 217 Zook St
- 914 S Detroit St
- 915 N 015 E
- 207 S Poplar St
- 737 N Canal St