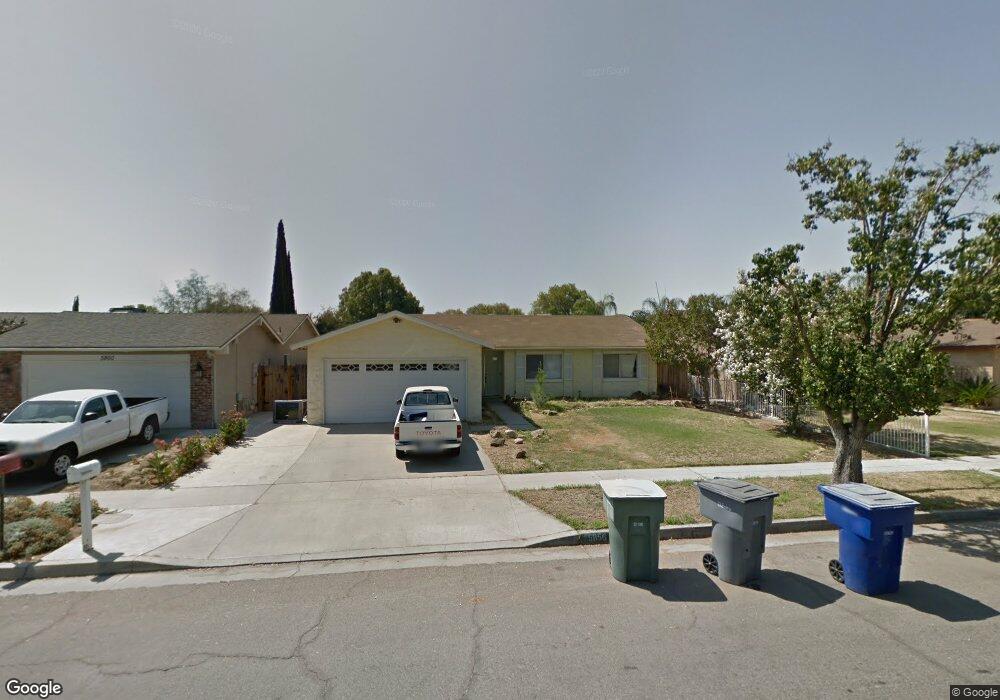
5856 E Ramona Ave Fresno, CA 93727
McLane NeighborhoodEstimated Value: $340,000 - $353,429
3
Beds
2
Baths
1,253
Sq Ft
$277/Sq Ft
Est. Value
About This Home
This home is located at 5856 E Ramona Ave, Fresno, CA 93727 and is currently estimated at $346,857, approximately $276 per square foot. 5856 E Ramona Ave is a home located in Fresno County with nearby schools including Tomahawk School, Miramonte Elementary School, and Reyburn Intermediate School.
Ownership History
Date
Name
Owned For
Owner Type
Purchase Details
Closed on
Nov 3, 2002
Sold by
Thomas Terry S and Thomas Tanya M
Bought by
Thomas Terry S and Thomas Tanya M
Current Estimated Value
Home Financials for this Owner
Home Financials are based on the most recent Mortgage that was taken out on this home.
Original Mortgage
$101,600
Outstanding Balance
$42,368
Interest Rate
5.96%
Estimated Equity
$304,489
Purchase Details
Closed on
Dec 17, 1999
Sold by
Gardner Tricia M and Banks Shaun
Bought by
Thomas Terry S and Rough Tanya M
Home Financials for this Owner
Home Financials are based on the most recent Mortgage that was taken out on this home.
Original Mortgage
$88,364
Interest Rate
7.87%
Mortgage Type
FHA
Purchase Details
Closed on
Apr 20, 1994
Sold by
Rosa Ronald L and Rosa Ruth
Bought by
Gardner Tricia M
Home Financials for this Owner
Home Financials are based on the most recent Mortgage that was taken out on this home.
Original Mortgage
$87,065
Interest Rate
7.67%
Mortgage Type
FHA
Create a Home Valuation Report for This Property
The Home Valuation Report is an in-depth analysis detailing your home's value as well as a comparison with similar homes in the area
Home Values in the Area
Average Home Value in this Area
Purchase History
| Date | Buyer | Sale Price | Title Company |
|---|---|---|---|
| Thomas Terry S | -- | Chicago Title Company | |
| Thomas Terry S | $88,500 | First American Title Co | |
| Gardner Tricia M | $87,500 | Stewart Title | |
| Gardner Tricia M | -- | Stewart Title |
Source: Public Records
Mortgage History
| Date | Status | Borrower | Loan Amount |
|---|---|---|---|
| Open | Thomas Terry S | $101,600 | |
| Closed | Thomas Terry S | $88,364 | |
| Previous Owner | Gardner Tricia M | $87,065 |
Source: Public Records
Tax History Compared to Growth
Tax History
| Year | Tax Paid | Tax Assessment Tax Assessment Total Assessment is a certain percentage of the fair market value that is determined by local assessors to be the total taxable value of land and additions on the property. | Land | Improvement |
|---|---|---|---|---|
| 2025 | $4,187 | $135,995 | $36,874 | $99,121 |
| 2023 | $4,155 | $130,716 | $35,443 | $95,273 |
| 2022 | $4,103 | $128,154 | $34,749 | $93,405 |
| 2021 | $1,536 | $125,642 | $34,068 | $91,574 |
| 2020 | $2,097 | $124,355 | $33,719 | $90,636 |
| 2019 | $1,500 | $121,917 | $33,058 | $88,859 |
| 2018 | $1,468 | $119,527 | $32,410 | $87,117 |
| 2017 | $1,443 | $117,184 | $31,775 | $85,409 |
| 2016 | $1,395 | $114,887 | $31,152 | $83,735 |
| 2015 | $1,374 | $113,163 | $30,685 | $82,478 |
| 2014 | $1,349 | $110,947 | $30,084 | $80,863 |
Source: Public Records
Map
Nearby Homes
- 3556 N Duke Ave Unit 165
- 3556 N Duke Ave Unit 175
- 3550 N Duke Ave Unit 37
- 3550 N Duke Ave Unit 10
- 3550 N Duke Ave Unit 12
- 5934 E Dakota Ave
- 3734 Manila Ave
- 5936 E Lansing Way
- 3624 Eddy Ave
- 3605 Phillip Ave
- 6402 E Millie Dr
- 3322 N Ezie Ave
- 5965 E Shields Ave Unit 178
- 6008 E Sussex Way
- 6157 E Garland Ave
- 4065 N Eddy Ave
- 5739 E Hampton Way
- 5703 E Hampton Way
- 6083 E Andrews Ave
- 5675 E Ashlan Ave
- 5860 E Ramona Ave
- 5850 E Ramona Ave
- 5864 E Ramona Ave
- 5846 E Ramona Ave
- 3714 N Purdue Ave
- 5868 E Ramona Ave
- 5842 E Ramona Ave
- 3711 N Purdue Ave
- 3713 N Fordham Ave
- 3724 N Purdue Ave
- 5836 E Ramona Ave
- 5874 E Ramona Ave
- 3721 N Purdue Ave
- 3732 N Purdue Ave
- 3712 N Miami Ave
- 5832 E Ramona Ave
- 3731 N Purdue Ave
- 3733 N Fordham Ave
- 5876 E Ramona Ave
- 3722 N Miami Ave