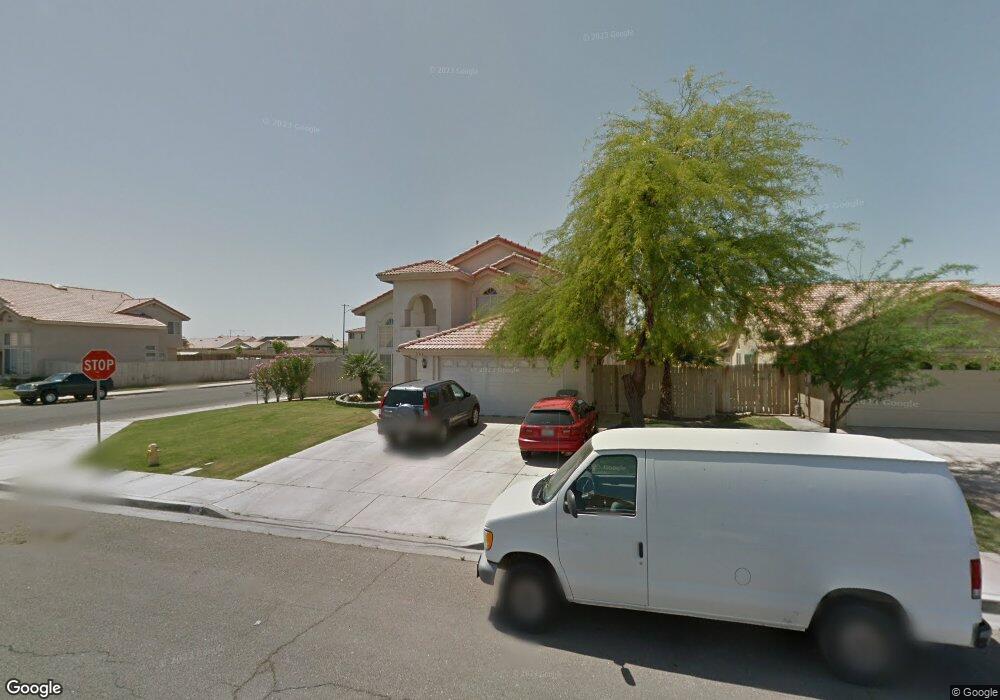
586 Snapdragon Way Imperial, CA 92251
Estimated Value: $507,424 - $558,000
4
Beds
3
Baths
2,348
Sq Ft
$226/Sq Ft
Est. Value
About This Home
This home is located at 586 Snapdragon Way, Imperial, CA 92251 and is currently estimated at $531,606, approximately $226 per square foot. 586 Snapdragon Way is a home located in Imperial County with nearby schools including T.L. Waggoner Elementary School, Frank M. Wright Middle School, and Imperial High School.
Ownership History
Date
Name
Owned For
Owner Type
Purchase Details
Closed on
Jul 21, 2008
Sold by
The Bank Of New York
Bought by
Corrales Marcelino and Corrales Tancy Susana
Current Estimated Value
Home Financials for this Owner
Home Financials are based on the most recent Mortgage that was taken out on this home.
Original Mortgage
$246,137
Outstanding Balance
$161,584
Interest Rate
6.42%
Mortgage Type
FHA
Estimated Equity
$370,022
Purchase Details
Closed on
Dec 14, 2007
Sold by
Paz Yolanda
Bought by
The Bank Of New York and Jpmorgan Chase Bank Na
Purchase Details
Closed on
Aug 27, 2002
Sold by
Mercado Martin and Mercado Yolanda
Bought by
Paz Yolanda
Purchase Details
Closed on
Feb 19, 1999
Sold by
Wildflower North Llc
Bought by
Mercado Martin and Mercado Yolanda
Home Financials for this Owner
Home Financials are based on the most recent Mortgage that was taken out on this home.
Original Mortgage
$178,600
Interest Rate
7.66%
Create a Home Valuation Report for This Property
The Home Valuation Report is an in-depth analysis detailing your home's value as well as a comparison with similar homes in the area
Home Values in the Area
Average Home Value in this Area
Purchase History
| Date | Buyer | Sale Price | Title Company |
|---|---|---|---|
| Corrales Marcelino | $250,000 | Lsi Title Company | |
| The Bank Of New York | $264,000 | None Available | |
| Paz Yolanda | -- | Commonwealth Land Title Co | |
| Mercado Martin | $198,500 | Commonwealth Land Title Co |
Source: Public Records
Mortgage History
| Date | Status | Borrower | Loan Amount |
|---|---|---|---|
| Open | Corrales Marcelino | $246,137 | |
| Previous Owner | Mercado Martin | $178,600 |
Source: Public Records
Tax History Compared to Growth
Tax History
| Year | Tax Paid | Tax Assessment Tax Assessment Total Assessment is a certain percentage of the fair market value that is determined by local assessors to be the total taxable value of land and additions on the property. | Land | Improvement |
|---|---|---|---|---|
| 2025 | $3,431 | $321,923 | $90,135 | $231,788 |
| 2023 | $3,431 | $309,425 | $86,636 | $222,789 |
| 2022 | $3,355 | $303,359 | $84,938 | $218,421 |
| 2021 | $3,303 | $297,412 | $83,273 | $214,139 |
| 2020 | $3,268 | $294,364 | $82,420 | $211,944 |
| 2019 | $3,222 | $288,593 | $80,804 | $207,789 |
| 2018 | $3,179 | $282,935 | $79,220 | $203,715 |
| 2017 | $2,991 | $277,388 | $77,667 | $199,721 |
| 2016 | $2,881 | $271,950 | $76,145 | $195,805 |
| 2015 | $2,912 | $267,866 | $75,002 | $192,864 |
| 2014 | $2,223 | $216,000 | $40,000 | $176,000 |
Source: Public Records
Map
Nearby Homes
- 517 Mesquite St
- 628 Lilac Ln
- 0 W Camino Antonio Ave
- 2471 Earhart Ave
- 682 Flying Cloud Dr W
- 2504 Vista Del Mar
- 675 Ocaso St
- 681 Ocaso St
- 672 Ocaso St
- 674 Ocaso St
- 676 Ocaso St
- 1850 Lincoln Ave Unit 91
- 1850 Lincoln Ave Unit 120
- 1850 Lincoln Ave Unit 107
- 2507 Valle Verde Ln
- 1850 W Lincoln Ave Unit 57
- 385 W Aten Rd
- 823 W Aten Rd
- 654 Las Villas St
- 631 Las Villas St
- 588 Snapdragon Way
- 584 Snapdragon Way
- 590 Snapdragon Way
- 587 Tamarisk St
- 592 Snapdragon Way
- 582 Snapdragon Way
- 589 Tamarisk St
- 587 Snapdragon Way
- 589 Snapdragon Way
- 591 Tamarisk St
- 591 Snapdragon Way
- 585 Snapdragon Way
- 2346 Bougainvillea Trail
- 580 0 Snapdragon Way
- 593 Tamarisk St
- 594 Snapdragon Way
- 580 Snapdragon Way
- 593 Snapdragon Way
- 583 Snapdragon Way
- 2344 Bougainvillea Trail