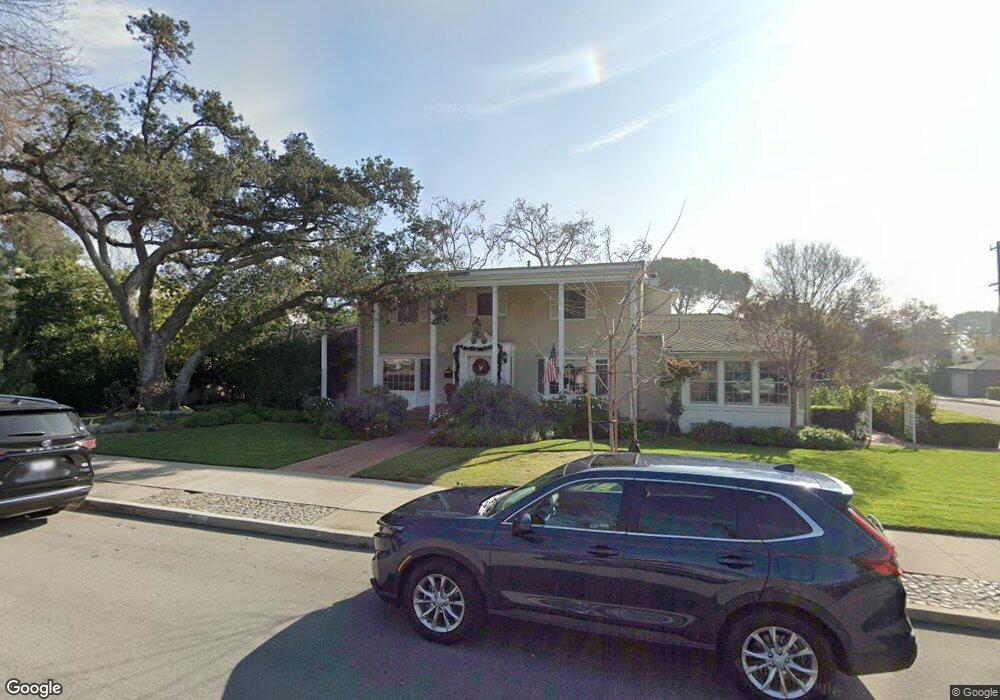
586 W 11th St Claremont, CA 91711
Old Claremont NeighborhoodEstimated Value: $1,780,000 - $2,000,603
4
Beds
3
Baths
3,772
Sq Ft
$499/Sq Ft
Est. Value
About This Home
This home is located at 586 W 11th St, Claremont, CA 91711 and is currently estimated at $1,881,151, approximately $498 per square foot. 586 W 11th St is a home located in Los Angeles County with nearby schools including Sycamore Elementary School, El Roble Intermediate School, and Claremont High School.
Ownership History
Date
Name
Owned For
Owner Type
Purchase Details
Closed on
Jan 17, 2013
Sold by
Houy Markus
Bought by
Houy Markus and Houy Tina
Current Estimated Value
Home Financials for this Owner
Home Financials are based on the most recent Mortgage that was taken out on this home.
Original Mortgage
$401,000
Outstanding Balance
$76,227
Interest Rate
3.33%
Mortgage Type
New Conventional
Estimated Equity
$1,804,924
Purchase Details
Closed on
Jun 21, 2010
Sold by
Houy Tina Jo
Bought by
Houy Markus and Houy Tina
Purchase Details
Closed on
Jan 7, 2010
Sold by
Blaine Bradford Bennett
Bought by
Heuy Tina Jo and Houy Markus M
Home Financials for this Owner
Home Financials are based on the most recent Mortgage that was taken out on this home.
Original Mortgage
$417,000
Interest Rate
5.03%
Mortgage Type
New Conventional
Purchase Details
Closed on
Jun 19, 1997
Sold by
Blaine Bradford B
Bought by
Blaine Bradford Bennett and Blaine Mary Anne
Create a Home Valuation Report for This Property
The Home Valuation Report is an in-depth analysis detailing your home's value as well as a comparison with similar homes in the area
Home Values in the Area
Average Home Value in this Area
Purchase History
| Date | Buyer | Sale Price | Title Company |
|---|---|---|---|
| Houy Markus | -- | Accommodation | |
| Houy Markus | -- | First American Title | |
| Houy Markus | -- | None Available | |
| Heuy Tina Jo | $950,000 | Fidelity National Title | |
| Blaine Bradford Bennett | -- | -- |
Source: Public Records
Mortgage History
| Date | Status | Borrower | Loan Amount |
|---|---|---|---|
| Open | Houy Markus | $401,000 | |
| Closed | Heuy Tina Jo | $417,000 |
Source: Public Records
Tax History Compared to Growth
Tax History
| Year | Tax Paid | Tax Assessment Tax Assessment Total Assessment is a certain percentage of the fair market value that is determined by local assessors to be the total taxable value of land and additions on the property. | Land | Improvement |
|---|---|---|---|---|
| 2025 | $16,414 | $1,379,403 | $774,489 | $604,914 |
| 2024 | $16,414 | $1,352,356 | $759,303 | $593,053 |
| 2023 | $16,070 | $1,325,840 | $744,415 | $581,425 |
| 2022 | $15,819 | $1,299,844 | $729,819 | $570,025 |
| 2021 | $15,582 | $1,274,358 | $715,509 | $558,849 |
| 2019 | $14,854 | $1,236,562 | $694,288 | $542,274 |
| 2018 | $14,518 | $1,212,317 | $680,675 | $531,642 |
| 2016 | $13,521 | $1,165,244 | $654,245 | $510,999 |
| 2015 | $13,326 | $1,147,742 | $644,418 | $503,324 |
| 2014 | $13,209 | $1,125,260 | $631,795 | $493,465 |
Source: Public Records
Map
Nearby Homes
- 470 W 11th St
- 555 W 9th St
- 584 W 9th St
- 540 W Baughman Ave
- 460 University Cir
- 464 W 8th St
- 357 W 10th St
- 1113 Yale Ave
- 750 W 8th St
- 290 W 12th St
- 207 Colby Cir
- 220 Babson Ct
- 1421 Rust Ct
- 1419 N Indian Hill Blvd
- 1458 N Mountain Ave
- 976 Butte St
- 944 Richmond Dr
- 194 Principia Ct
- The Maple Plan at Descanso Walk
- The Eucalyptus Plan at Descanso Walk