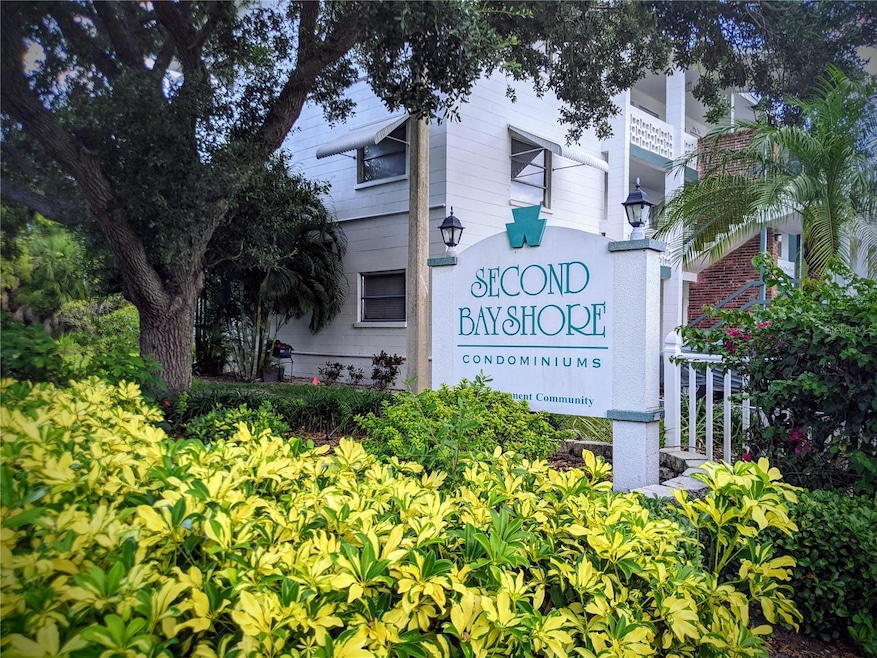

5862 Welcome Rd Unit J25 Bradenton, FL 34207
Estimated payment $547/month
Highlights
- Heated In Ground Pool
- View of Trees or Woods
- Property is near public transit
- Active Adult
- Clubhouse
- Private Lot
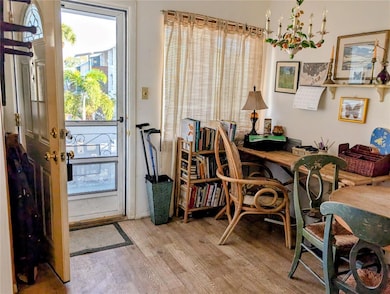
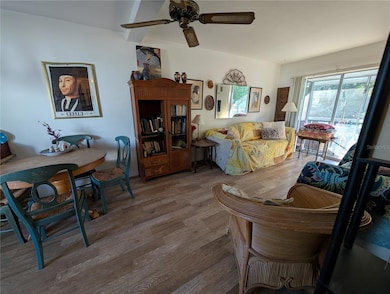
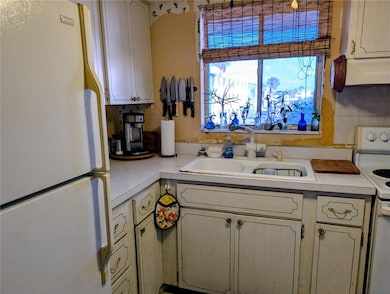
About This Home
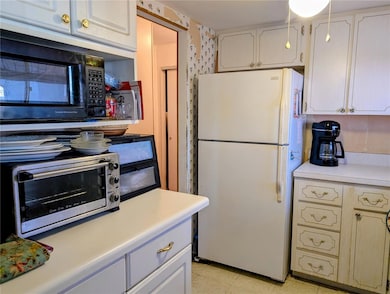
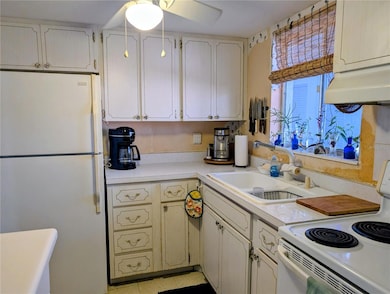
COMPETITIVELY PRICED TO SELL - RIGHT NOW! Rare chance to own a distressed 1BR/1BA condo in a well-maintained 55+ community. Located on the 2nd floor, this unit is ready for renovation and rehab; it offers a spacious layout with great potential. Ideal for investors or buyers seeking sweat-equity. Enjoy access to community features such as the spacious clubhouse, pool, BBQ grill for the outdoor chef, coin laundry, shuffleboard and beautifully kept grounds. Fantastic value—don’t miss this opportunity. Close to the Bayshore Gardens Shopping Center, the SRQ airport, places to eat out. Public Bus line is nearby if you'd rather not drive. Interested? Do not wait....
Listing Agent
BAYSHORE REALTY INC Brokerage Phone: 941-755-3701 License #0621669 Listed on: 11/21/2025
Property Details
Home Type
- Condominium
Est. Annual Taxes
- $472
Year Built
- Built in 1970
Lot Details
- East Facing Home
- Mature Landscaping
- Level Lot
HOA Fees
- $207 Monthly HOA Fees
Home Design
- Entry on the 2nd floor
- Slab Foundation
- Shingle Roof
- Block Exterior
- Stucco
Interior Spaces
- 576 Sq Ft Home
- 3-Story Property
- Furnished
- Ceiling Fan
- Sliding Doors
- Combination Dining and Living Room
- Views of Woods
Kitchen
- Range
- Microwave
Flooring
- Wood
- Carpet
- Laminate
- Vinyl
Bedrooms and Bathrooms
- 1 Bedroom
- 1 Full Bathroom
Home Security
Parking
- Guest Parking
- Assigned Parking
Pool
- Heated In Ground Pool
- Heated Spa
- Gunite Pool
- Outdoor Shower
Outdoor Features
- Screened Patio
- Outdoor Storage
- Outdoor Grill
Location
- Property is near public transit
Utilities
- Ductless Heating Or Cooling System
- Cooling System Mounted To A Wall/Window
- Electric Water Heater
- High Speed Internet
- Cable TV Available
Listing and Financial Details
- Visit Down Payment Resource Website
- Tax Lot J25
- Assessor Parcel Number 5903803954
Community Details
Overview
- Active Adult
- Association fees include common area taxes, pool, escrow reserves fund, fidelity bond, maintenance structure, ground maintenance, management, trash
- Darcy Borregard, Property Mgr, Casey Mgmt Association, Phone Number (941) 755-6338
- Visit Association Website
- Mid-Rise Condominium
- Bayshore Condominium Community
- Bayshore II Sec 17 Subdivision
- Association Owns Recreation Facilities
Amenities
- Clubhouse
- Laundry Facilities
- Elevator
- Community Mailbox
Recreation
- Shuffleboard Court
- Community Pool
- Community Spa
Pet Policy
- No Pets Allowed
Security
- Fire and Smoke Detector
Map
Home Values in the Area
Average Home Value in this Area
Tax History
| Year | Tax Paid | Tax Assessment Tax Assessment Total Assessment is a certain percentage of the fair market value that is determined by local assessors to be the total taxable value of land and additions on the property. | Land | Improvement |
|---|---|---|---|---|
| 2025 | $472 | $39,816 | -- | -- |
| 2024 | $472 | $38,694 | -- | -- |
| 2023 | $441 | $37,567 | $0 | $0 |
| 2022 | $410 | $36,473 | $0 | $0 |
| 2021 | $369 | $35,411 | $0 | $0 |
| 2020 | $367 | $34,922 | $0 | $0 |
| 2019 | $345 | $34,137 | $0 | $0 |
| 2018 | $326 | $33,500 | $0 | $0 |
| 2017 | $602 | $31,000 | $0 | $0 |
| 2016 | $542 | $24,750 | $0 | $0 |
| 2015 | $460 | $21,000 | $0 | $0 |
| 2014 | $460 | $18,481 | $0 | $0 |
| 2013 | $434 | $17,161 | $1 | $17,160 |
Property History
| Date | Event | Price | List to Sale | Price per Sq Ft |
|---|---|---|---|---|
| 11/21/2025 11/21/25 | For Sale | $57,000 | -- | $99 / Sq Ft |
Purchase History
| Date | Type | Sale Price | Title Company |
|---|---|---|---|
| Trustee Deed | $37,800 | Sunbelt Title Agency | |
| Interfamily Deed Transfer | -- | None Available | |
| Warranty Deed | $75,000 | Chelsea Title Company | |
| Warranty Deed | $23,900 | -- |
Mortgage History
| Date | Status | Loan Amount | Loan Type |
|---|---|---|---|
| Previous Owner | $18,900 | No Value Available |
Source: Stellar MLS
MLS Number: A4672855
APN: 59038-0395-4
Disclaimer: Certain information contained herein is derived from information provided by parties other than Homes.com. All information provided is deemed reliable, but is not guaranteed to be accurate and should be independently verified.
![]() IDX information is provided exclusively for personal, non-commercial use, and may not be used for any purpose other than to identify prospective properties consumers may be interested in purchasing. Information is deemed reliable but not guaranteed.
IDX information is provided exclusively for personal, non-commercial use, and may not be used for any purpose other than to identify prospective properties consumers may be interested in purchasing. Information is deemed reliable but not guaranteed.
Listing Information presented by local MLS brokerage: Ten-X - (888)-952-6393
- 5850 Welcome Rd Unit J6
- 1880 Sunny Dr Unit F35
- 1864 Sunny Dr Unit F24
- 5938 Welcome Rd Unit H22
- 1867 Restful Dr Unit L22
- 5891 Welcome Rd Unit I6
- 1853 Restful Dr Unit L2
- 1847 Sunny Dr Unit G4
- 1807 Restful Dr Unit N4
- 1815 Restful Dr Unit N27
- 1828 Sunny Dr Unit D27
- 5857 Palm Ln Unit B22
- 5855 Palm Ln Unit B21
- 5888 17th St W Unit C23
- 1827 Sunny Dr Unit E27
- 1832 Sunny Dr Unit D32
- 1838 Sunny Dr Unit D35
- 5918 Palm Ln Unit C33
- 5912 Palm Ln Unit C36
- 5904 Palm Ln Unit C23
- 1863 Sunny Dr Unit G22
- 1818 Restful Dr Unit M23
- 1801 Restful Dr Unit N7
- 5908 17th St W Unit C36
- 1836 Sunny Dr Unit D34
- 1515 60th Ave W
- 2047 Canal Dr Unit L6
- 5820 21st St W
- 5906 Garden Ln Unit A22
- 1522 Pleasant Rd Unit G23
- 1514 Pleasant Rd Unit G6
- 1625 Leisure Dr Unit C26
- 1507 Pleasant Rd Unit A3
- 5883 Todd St Unit E21
- 1502 Dartmouth Dr
- 5812 24th Street Ct W
- 2505 Flamingo Blvd Unit L9
- 2415 Bayshore Gardens Pkwy Unit 8
- 2701 60th Avenue Plaza N Unit 8D
- 2713 60th Avenue Dr W
