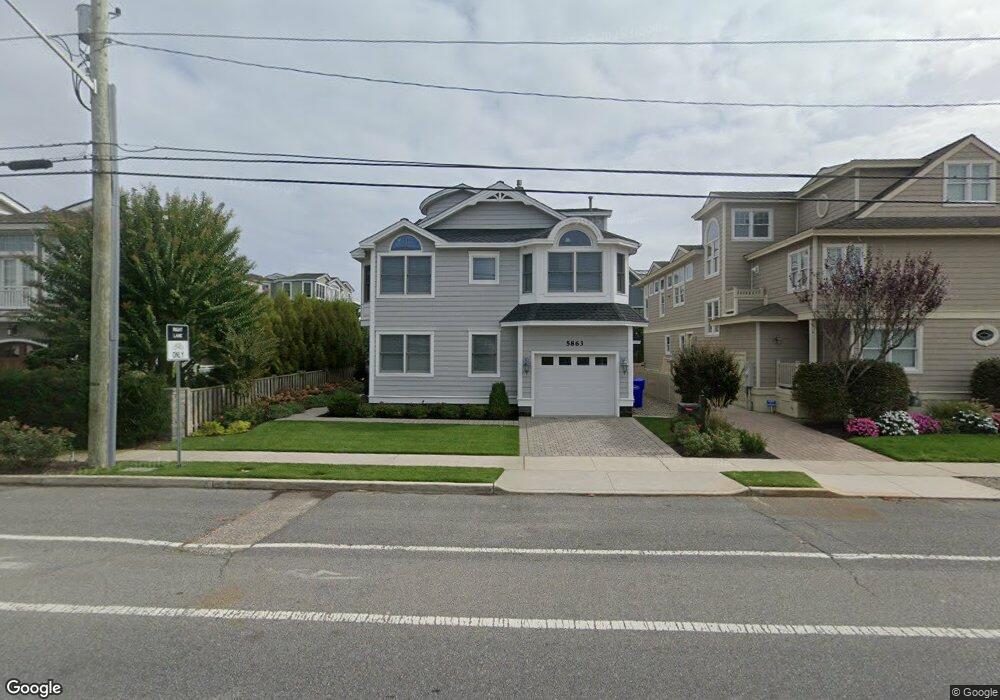
5863 Dune Dr Avalon, NJ 08202
Estimated Value: $3,872,323 - $4,616,000
4
Beds
3
Baths
3,656
Sq Ft
$1,133/Sq Ft
Est. Value
About This Home
This home is located at 5863 Dune Dr, Avalon, NJ 08202 and is currently estimated at $4,142,331, approximately $1,133 per square foot. 5863 Dune Dr is a home located in Cape May County with nearby schools including Avalon Elementary School.
Ownership History
Date
Name
Owned For
Owner Type
Purchase Details
Closed on
Sep 13, 2024
Sold by
Thomas J K J and Thomas Mary D
Bought by
Napa Holdings Richmond Llc
Current Estimated Value
Purchase Details
Closed on
Feb 26, 1993
Sold by
Ohara Jr William J
Bought by
Thomas Thomas Jr J and Thomas Mary D
Purchase Details
Closed on
Jan 30, 1990
Sold by
Schulze,D Rementer J and Schulzed Exec
Bought by
Ohara William
Create a Home Valuation Report for This Property
The Home Valuation Report is an in-depth analysis detailing your home's value as well as a comparison with similar homes in the area
Home Values in the Area
Average Home Value in this Area
Purchase History
| Date | Buyer | Sale Price | Title Company |
|---|---|---|---|
| Napa Holdings Richmond Llc | $3,695,000 | Seaboard Title | |
| Napa Holdings Richmond Llc | $3,695,000 | Seaboard Title | |
| Thomas Thomas Jr J | $395,000 | -- | |
| Thomas Thomas J | $395,000 | -- | |
| Ohara William | $375,000 | -- |
Source: Public Records
Tax History
| Year | Tax Paid | Tax Assessment Tax Assessment Total Assessment is a certain percentage of the fair market value that is determined by local assessors to be the total taxable value of land and additions on the property. | Land | Improvement |
|---|---|---|---|---|
| 2025 | $11,723 | $1,909,300 | $1,200,000 | $709,300 |
| 2024 | $11,723 | $1,909,300 | $1,200,000 | $709,300 |
Source: Public Records
Map
Nearby Homes
- 5765 Ocean Dr
- 5499 Dune Dr
- 6229 Dune Dr
- 150 64th St
- 6762 Ocean Dr Unit 6762
- 6772 Ocean Dr Unit 6772
- 4640 Ocean Dr
- 177 71st St
- 4610 4th Ave
- 256 42nd St
- 7463 Ocean Dr
- 264 41st St
- 4040 Dune Dr
- 198 40th St
- 360 39th St Unit East
- 7800 Dune Dr Unit C205
- 7888 Dune Dr Unit 218
- 315 79th St Unit 315
- 7900 Dune Dr Unit C315
- 280 79th St Unit 1
Your Personal Tour Guide
Ask me questions while you tour the home.