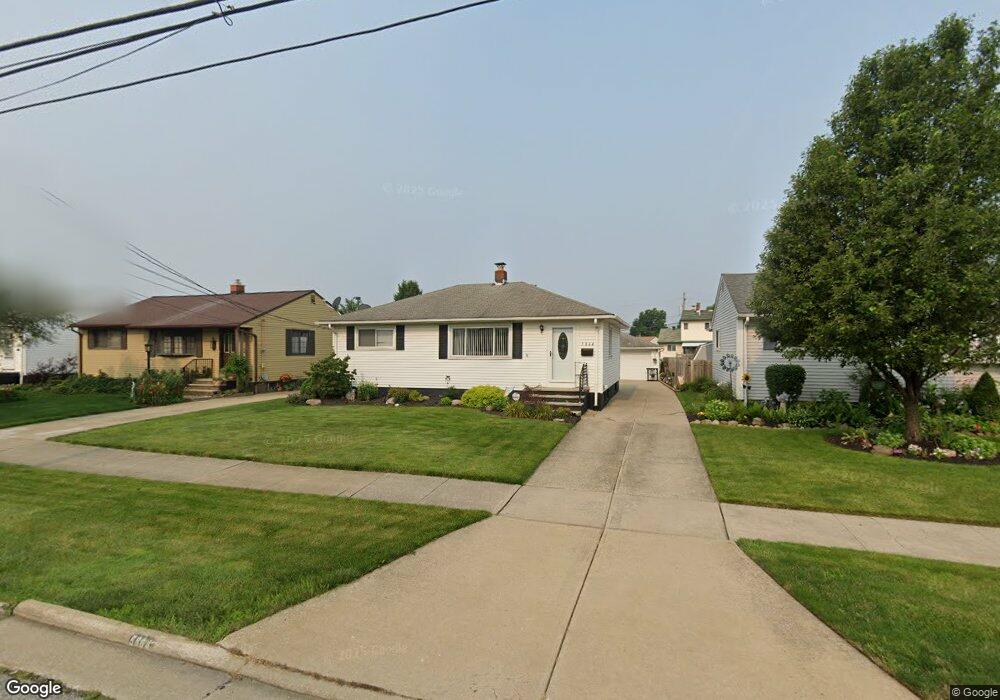
5864 Fry Rd Brookpark, OH 44142
Estimated Value: $195,718 - $220,000
3
Beds
1
Bath
936
Sq Ft
$223/Sq Ft
Est. Value
About This Home
This home is located at 5864 Fry Rd, Brookpark, OH 44142 and is currently estimated at $208,930, approximately $223 per square foot. 5864 Fry Rd is a home located in Cuyahoga County with nearby schools including Berea-Midpark Middle School, Berea-Midpark High School, and Huber Heights Preparatory Academy Parma Academy.
Ownership History
Date
Name
Owned For
Owner Type
Purchase Details
Closed on
Nov 22, 2010
Sold by
Estate Of Rossie M Norris Sr
Bought by
Zupancic Karen M and Norris Roger M
Current Estimated Value
Purchase Details
Closed on
Nov 16, 2010
Sold by
Zupancic Karen E and Norris Roger M
Bought by
Norris Roger M
Purchase Details
Closed on
Apr 14, 2003
Sold by
Childress Melody
Bought by
Norris Rossie M
Purchase Details
Closed on
Mar 11, 2003
Sold by
Estate Of Mary L Mccarthy
Bought by
Mccarthy Howard J
Purchase Details
Closed on
Sep 22, 2000
Sold by
Mccarthy Howard J
Bought by
Mccarthy Howard J and Childress Melody
Purchase Details
Closed on
Nov 24, 1992
Sold by
Mccarthy Howard J
Bought by
Mccarthy Mary
Purchase Details
Closed on
Jul 24, 1991
Bought by
Mccarthy Howard J
Purchase Details
Closed on
Jan 11, 1978
Sold by
Maschek Larry A
Bought by
Mccarthy Howard J
Purchase Details
Closed on
Jan 1, 1975
Bought by
Maschek Larry A
Create a Home Valuation Report for This Property
The Home Valuation Report is an in-depth analysis detailing your home's value as well as a comparison with similar homes in the area
Home Values in the Area
Average Home Value in this Area
Purchase History
| Date | Buyer | Sale Price | Title Company |
|---|---|---|---|
| Zupancic Karen M | -- | None Available | |
| Norris Roger M | -- | None Available | |
| Norris Rossie M | $95,000 | Lawyers Title Insurance Corp | |
| Norris Rossie M | -- | Lawyers Title Insurance Corp | |
| Mccarthy Howard J | -- | -- | |
| Mccarthy Howard J | -- | -- | |
| Mccarthy Mary | -- | -- | |
| Mccarthy Howard J | -- | -- | |
| Mccarthy, James (Trustee) | -- | -- | |
| Mccarthy Howard J | $48,500 | -- | |
| Maschek Larry A | -- | -- |
Source: Public Records
Tax History Compared to Growth
Tax History
| Year | Tax Paid | Tax Assessment Tax Assessment Total Assessment is a certain percentage of the fair market value that is determined by local assessors to be the total taxable value of land and additions on the property. | Land | Improvement |
|---|---|---|---|---|
| 2024 | $2,876 | $55,790 | $10,080 | $45,710 |
| 2023 | $2,746 | $44,110 | $9,490 | $34,620 |
| 2022 | $2,727 | $44,100 | $9,485 | $34,615 |
| 2021 | $2,713 | $44,100 | $9,490 | $34,620 |
| 2020 | $2,447 | $35,000 | $7,530 | $27,480 |
| 2019 | $2,376 | $100,000 | $21,500 | $78,500 |
| 2018 | $1,183 | $35,000 | $7,530 | $27,480 |
| 2017 | $2,275 | $31,090 | $7,600 | $23,490 |
| 2016 | $2,257 | $31,090 | $7,600 | $23,490 |
| 2015 | $6,104 | $31,090 | $7,600 | $23,490 |
| 2014 | $6,104 | $32,730 | $7,980 | $24,750 |
Source: Public Records
Map
Nearby Homes
- 6054 Langer Dr
- 5966 Engle Rd
- 15800 Holland Rd
- 16051 Holland Rd
- 16310 Richard Dr
- 15450 Holland Rd
- 6195 Hardin Dr
- 6366 Sandhurst Dr
- 6363 Lockhaven Dr
- 14890 Holland Rd
- 5677 Gateway Ln Unit E504
- 6378 Edgehurst Dr
- 14417 Parkman Blvd
- 6470 Sandfield Dr
- 18009 Kalvin Dr
- 14344 Fayette Blvd
- 5348 W 147th St
- 5198 W 148th St
- 6401 Scott Dr
- 6409 Scott Dr