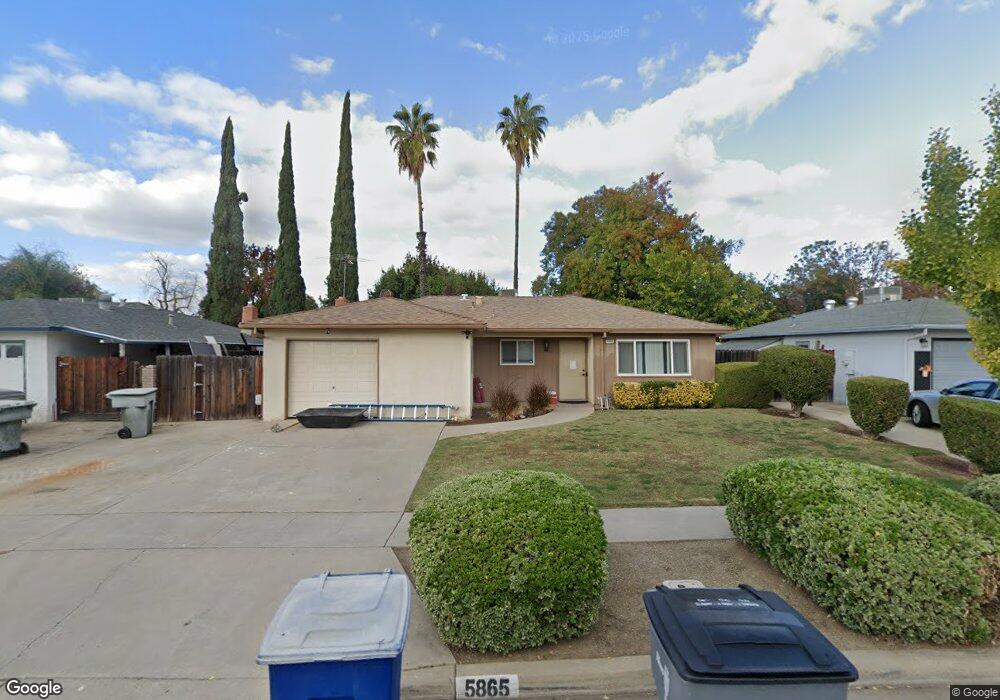
5865 E Lansing Way Fresno, CA 93727
McLane NeighborhoodEstimated Value: $328,554 - $369,000
4
Beds
2
Baths
1,344
Sq Ft
$257/Sq Ft
Est. Value
About This Home
This home is located at 5865 E Lansing Way, Fresno, CA 93727 and is currently estimated at $345,639, approximately $257 per square foot. 5865 E Lansing Way is a home located in Fresno County with nearby schools including Tomahawk School, Miramonte Elementary School, and Reyburn Intermediate School.
Ownership History
Date
Name
Owned For
Owner Type
Purchase Details
Closed on
Dec 9, 2020
Sold by
Baker Gerald and Baker Nelda
Bought by
Baker Gerald M and Baker Nelda
Current Estimated Value
Home Financials for this Owner
Home Financials are based on the most recent Mortgage that was taken out on this home.
Original Mortgage
$111,000
Outstanding Balance
$98,999
Interest Rate
2.8%
Mortgage Type
New Conventional
Estimated Equity
$246,640
Purchase Details
Closed on
Mar 25, 2019
Sold by
Baker Gerald M and Baker Nelda
Bought by
Baker Gerald M and Fam Nelda N Baker 2014
Purchase Details
Closed on
Feb 2, 2011
Sold by
Neufeld Phyllis J
Bought by
Baker Gerald M and Baker Nelda
Home Financials for this Owner
Home Financials are based on the most recent Mortgage that was taken out on this home.
Original Mortgage
$57,750
Interest Rate
4.67%
Mortgage Type
New Conventional
Create a Home Valuation Report for This Property
The Home Valuation Report is an in-depth analysis detailing your home's value as well as a comparison with similar homes in the area
Home Values in the Area
Average Home Value in this Area
Purchase History
| Date | Buyer | Sale Price | Title Company |
|---|---|---|---|
| Baker Gerald M | -- | Fidelity National Title Co | |
| Baker Gerald | -- | Fidelity National Title Co | |
| Baker Gerald M | -- | None Available | |
| Baker Gerald M | $77,000 | Stewart Title Of California |
Source: Public Records
Mortgage History
| Date | Status | Borrower | Loan Amount |
|---|---|---|---|
| Open | Baker Gerald | $111,000 | |
| Closed | Baker Gerald M | $57,750 |
Source: Public Records
Tax History Compared to Growth
Tax History
| Year | Tax Paid | Tax Assessment Tax Assessment Total Assessment is a certain percentage of the fair market value that is determined by local assessors to be the total taxable value of land and additions on the property. | Land | Improvement |
|---|---|---|---|---|
| 2025 | $1,289 | $105,041 | $44,833 | $60,208 |
| 2023 | $1,241 | $100,964 | $43,093 | $57,871 |
| 2022 | $1,224 | $98,986 | $42,249 | $56,737 |
| 2021 | $1,191 | $97,046 | $41,421 | $55,625 |
| 2020 | $1,186 | $96,052 | $40,997 | $55,055 |
| 2019 | $1,163 | $94,170 | $40,194 | $53,976 |
| 2018 | $1,138 | $92,324 | $39,406 | $52,918 |
| 2017 | $1,119 | $90,515 | $38,634 | $51,881 |
| 2016 | $1,082 | $88,741 | $37,877 | $50,864 |
| 2015 | $1,066 | $87,409 | $37,309 | $50,100 |
| 2014 | $1,046 | $85,698 | $36,579 | $49,119 |
Source: Public Records
Map
Nearby Homes
- 5936 E Lansing Way
- 5934 E Dakota Ave
- 3556 N Duke Ave Unit 165
- 3550 N Duke Ave Unit 37
- 3550 N Duke Ave Unit 10
- 3550 N Duke Ave Unit 12
- 3624 Eddy Ave
- 3734 Manila Ave
- 3605 Phillip Ave
- 6008 E Sussex Way
- 5739 E Hampton Way
- 4065 N Eddy Ave
- 3322 N Ezie Ave
- 5703 E Hampton Way
- 6402 E Millie Dr
- 5965 E Shields Ave Unit 178
- 6157 E Garland Ave
- 5675 E Ashlan Ave
- 1424 Tarpey Dr
- 6165 E Farrin Ave
- 5859 E Lansing Way
- 5869 E Lansing Way
- 5862 E Saginaw Way
- 5855 E Lansing Way
- 5856 E Saginaw Way
- 5866 E Saginaw Way
- 5852 E Saginaw Way
- 5864 E Lansing Way
- 5868 E Lansing Way
- 5858 E Lansing Way
- 5872 E Lansing Way
- 5854 E Lansing Way
- 5848 E Saginaw Way
- 3852 N Fordham Ave
- 3862 N Fordham Ave
- 3870 N Fordham Ave
- 5847 E Lansing Way
- 5876 E Lansing Way
- 5850 E Lansing Way