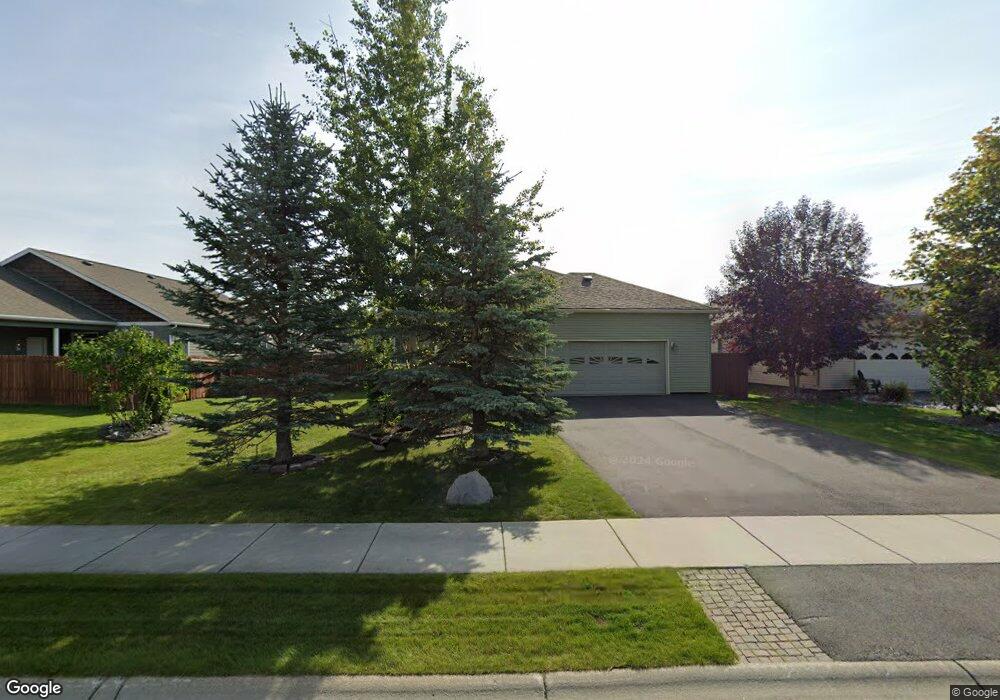
5867 Kenai Fjords Loop Anchorage, AK 99502
Sand Lake NeighborhoodEstimated Value: $278,000 - $631,000
3
Beds
2
Baths
2,140
Sq Ft
$248/Sq Ft
Est. Value
About This Home
This home is located at 5867 Kenai Fjords Loop, Anchorage, AK 99502 and is currently estimated at $531,549, approximately $248 per square foot. 5867 Kenai Fjords Loop is a home located in Anchorage Municipality with nearby schools including Kincaid Elementary, Mears Middle School, and Dimond High School.
Ownership History
Date
Name
Owned For
Owner Type
Purchase Details
Closed on
May 1, 2017
Sold by
Vickery Richard and Vieira Alberta M
Bought by
Anderson Lyudmila M
Current Estimated Value
Home Financials for this Owner
Home Financials are based on the most recent Mortgage that was taken out on this home.
Interest Rate
4.03%
Purchase Details
Closed on
Mar 22, 2007
Sold by
Hultquist Homes Inc
Bought by
Vickery Richard and Vieira Alberta M
Home Financials for this Owner
Home Financials are based on the most recent Mortgage that was taken out on this home.
Original Mortgage
$339,000
Interest Rate
6.31%
Mortgage Type
Purchase Money Mortgage
Purchase Details
Closed on
Mar 27, 2006
Sold by
White Raven Development Inc
Bought by
Hultquist Homes Inc
Home Financials for this Owner
Home Financials are based on the most recent Mortgage that was taken out on this home.
Original Mortgage
$344,000
Interest Rate
6.25%
Mortgage Type
Construction
Create a Home Valuation Report for This Property
The Home Valuation Report is an in-depth analysis detailing your home's value as well as a comparison with similar homes in the area
Home Values in the Area
Average Home Value in this Area
Purchase History
| Date | Buyer | Sale Price | Title Company |
|---|---|---|---|
| Anderson Lyudmila M | -- | -- | |
| Vickery Richard | -- | None Available | |
| Hultquist Homes Inc | -- | None Available |
Source: Public Records
Mortgage History
| Date | Status | Borrower | Loan Amount |
|---|---|---|---|
| Closed | Anderson Lyudmila M | -- | |
| Previous Owner | Vickery Richard | $339,000 | |
| Previous Owner | Hultquist Homes Inc | $344,000 |
Source: Public Records
Tax History Compared to Growth
Tax History
| Year | Tax Paid | Tax Assessment Tax Assessment Total Assessment is a certain percentage of the fair market value that is determined by local assessors to be the total taxable value of land and additions on the property. | Land | Improvement |
|---|---|---|---|---|
| 2025 | $5,095 | $572,800 | $155,800 | $417,000 |
| 2024 | $5,095 | $540,600 | $137,900 | $402,700 |
| 2023 | $4,341 | $479,900 | $131,300 | $348,600 |
| 2022 | $4,602 | $473,300 | $131,300 | $342,000 |
| 2021 | $8,073 | $448,000 | $131,300 | $316,700 |
| 2020 | $3,929 | $432,300 | $131,300 | $301,000 |
| 2019 | $3,933 | $440,400 | $131,300 | $309,100 |
| 2018 | $6,257 | $431,500 | $131,300 | $300,200 |
| 2017 | $6,707 | $428,300 | $131,300 | $297,000 |
| 2016 | $6,332 | $441,600 | $131,300 | $310,300 |
| 2015 | $6,332 | $436,000 | $131,300 | $304,700 |
| 2014 | $6,332 | $426,500 | $131,300 | $295,200 |
Source: Public Records
Map
Nearby Homes
- 5785 Kenai Fjords Loop
- 5729 Grand Teton Loop
- 7865 Crane Cir
- 6321 Wooded Cir
- 5372 Sandhill Loop
- 5376 Sandhill Loop
- 6460 Quiet Cir
- 6440/6460 Quiet Cir
- 5767 Cobbler Dr
- 6440 Quiet Cir
- 8698 Dry Creek Loop Unit 61A
- 8803 Chalk Hill Loop
- L11 B2 Beck's View Cir
- 8833 Chalk Hill Loop
- 8868 Chalk Hill Loop
- 5810 Muirwood Dr
- 8840 Becks View Cir
- 8869 Chalk Hill Loop
- 6057 Jan Marie Dr
- 8881 Chalk Hill Loop
- 5859 Kenai Fjords Loop
- 5881 Kenai Fjords Loop
- 5889 Kenai Fjords Loop
- 5825 Kenai Fjords Loop
- 5771 Kenai Fjords Loop
- 5581 Grand Teton Loop
- 5864 Kenai Fjords Loop
- 5589 Grand Teton Loop
- 5769 Kenai Fjords Loop
- 5878 Kenai Fjords Loop
- 5856 Kenai Fjords Loop
- 5573 Grand Teton Loop
- 5884 Kenai Fjords Loop
- 5838 Kenai Fjords Loop
- L46 B7 Kenai Fjords Loop
- 5896 Kenai Fjords Loop
- 5850 Kenai Fjords Loop
- L35 B8 Kenai Fjords Loop
- L16 B8 Kenai Fjords Loop
- L8 B8 Kenai Fjords Loop