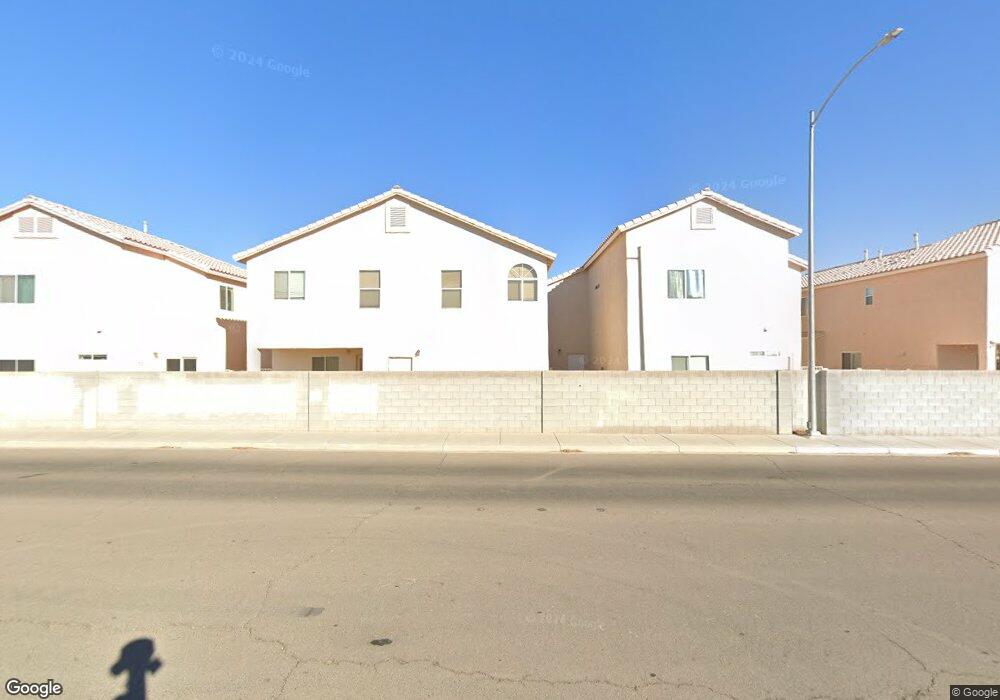
5868 Aimless St Unit 2 Henderson, NV 89011
Midway NeighborhoodEstimated Value: $382,000 - $459,960
4
Beds
3
Baths
2,261
Sq Ft
$187/Sq Ft
Est. Value
About This Home
This home is located at 5868 Aimless St Unit 2, Henderson, NV 89011 and is currently estimated at $422,490, approximately $186 per square foot. 5868 Aimless St Unit 2 is a home located in Clark County with nearby schools including Harriet Treem Elementary School, Jim Thorpe Elementary School, and Francis H Cortney Junior High School.
Ownership History
Date
Name
Owned For
Owner Type
Purchase Details
Closed on
Sep 14, 2011
Sold by
Parenteau Wayne M
Bought by
Parenteau Amelia C
Current Estimated Value
Purchase Details
Closed on
Mar 17, 2004
Sold by
Wicker Steve and Calambro Noemi
Bought by
Lamberth Jason and Lamberth Jennifer
Home Financials for this Owner
Home Financials are based on the most recent Mortgage that was taken out on this home.
Original Mortgage
$204,000
Interest Rate
4.87%
Mortgage Type
Unknown
Purchase Details
Closed on
Mar 28, 2002
Sold by
D R Horton Inc
Bought by
Wicker Steve and Calambro Noemi
Home Financials for this Owner
Home Financials are based on the most recent Mortgage that was taken out on this home.
Original Mortgage
$172,174
Interest Rate
6.84%
Mortgage Type
VA
Create a Home Valuation Report for This Property
The Home Valuation Report is an in-depth analysis detailing your home's value as well as a comparison with similar homes in the area
Home Values in the Area
Average Home Value in this Area
Purchase History
| Date | Buyer | Sale Price | Title Company |
|---|---|---|---|
| Parenteau Amelia C | -- | Chicago Title Las Vegas | |
| Parenteau Amelia C | $120,000 | Chicago Title Las Vegas | |
| Lamberth Jason | $255,000 | Old Republic Title Co Of Ne | |
| Wicker Steve | $167,160 | United Title |
Source: Public Records
Mortgage History
| Date | Status | Borrower | Loan Amount |
|---|---|---|---|
| Previous Owner | Lamberth Jason | $204,000 | |
| Previous Owner | Wicker Steve | $172,174 | |
| Closed | Lamberth Jason | $51,000 |
Source: Public Records
Tax History
| Year | Tax Paid | Tax Assessment Tax Assessment Total Assessment is a certain percentage of the fair market value that is determined by local assessors to be the total taxable value of land and additions on the property. | Land | Improvement |
|---|---|---|---|---|
| 2026 | $2,091 | $113,162 | $34,545 | $78,617 |
| 2025 | $1,936 | $109,271 | $29,260 | $80,011 |
| 2024 | $1,793 | $109,271 | $29,260 | $80,011 |
| 2023 | $1,793 | $105,395 | $29,768 | $75,627 |
| 2022 | $1,661 | $96,608 | $27,563 | $69,045 |
| 2021 | $1,538 | $89,132 | $23,520 | $65,612 |
| 2020 | $1,425 | $88,561 | $23,520 | $65,041 |
| 2019 | $1,336 | $85,697 | $21,683 | $64,014 |
| 2018 | $1,275 | $76,172 | $15,068 | $61,104 |
| 2017 | $2,255 | $76,661 | $15,068 | $61,593 |
| 2016 | $1,194 | $62,189 | $11,760 | $50,429 |
| 2015 | $1,191 | $48,471 | $10,290 | $38,181 |
| 2014 | $1,154 | $37,929 | $5,880 | $32,049 |
Source: Public Records
Map
Nearby Homes
- 5854 Gentleslope St
- 5940 High Steed St Unit 101
- 5968 Trickling Descent St Unit 103
- 5969 High Steed St Unit 101
- 6380 Extreme Shear Ave Unit 101
- 6346 Rusticated Stone Ave Unit 102
- 6388 Extreme Shear Ave Unit 103
- 6354 Rusticated Stone Ave Unit 101
- 6326 Lorne Green Ave Unit 102
- 6065 Washland Dr Unit 102
- 6425 Extreme Shear Ave Unit 101
- 6405 Rusticated Stone Ave Unit 103
- 6064 Nestled Foot St Unit 102
- 6463 Saddle Up Ave Unit 102
- 6090 Allred Place Unit 101
- 6568 Strolling Plains Ln Unit 102
- 929 Kyanite Ln
- 909 Kyanite Ln
- 6610 Tumbleweed Ridge Ln Unit 101
- 1111 Heliodor Ave
- 5860 Aimless St
- 5860 Aimless St
- 5860 Aimless St
- 5860 Aimless St
- 5886 Aimless St
- 5852 Aimless St
- 5867 Aimless St
- 5869 Gentleslope St Unit 2
- 5885 Gentleslope St Unit 2
- 5859 Aimless St Unit 2
- 5861 Gentleslope St
- 5890 Aimless St
- 5883 Aimless St
- 5844 Aimless St
- 5851 Aimless St Unit n/a
- 5851 Aimless St
- 5891 Gentleslope St
- 5889 Aimless St Unit 2
- 5898 Aimless St
- 5845 Gentleslope St Unit 2
Your Personal Tour Guide
Ask me questions while you tour the home.