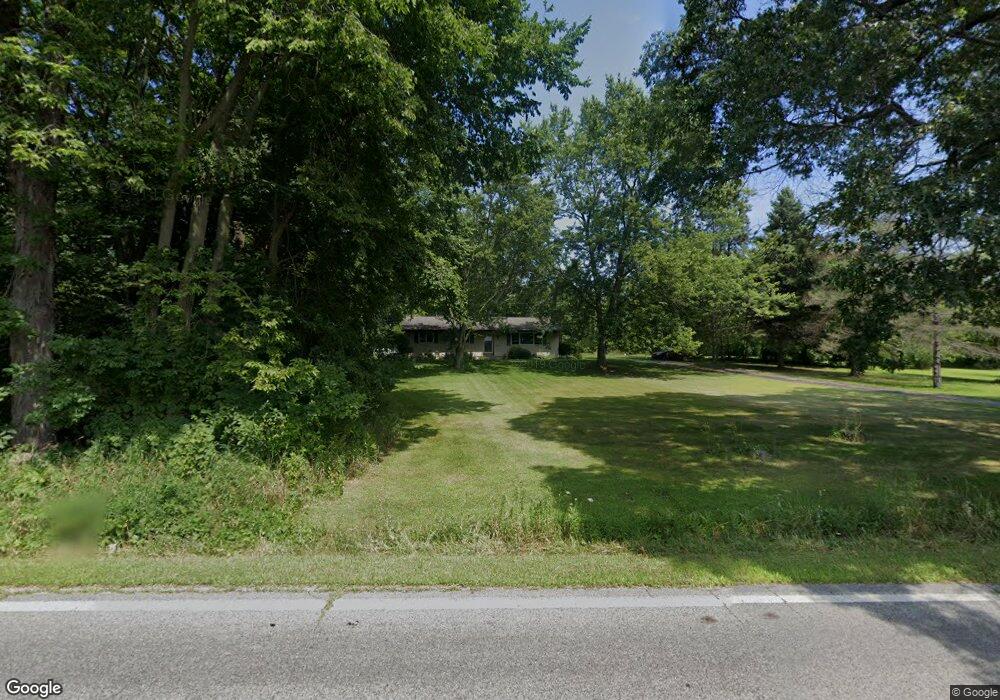
5868 Springport Rd Jackson, MI 49201
Estimated Value: $272,000 - $424,000
3
Beds
2
Baths
1,196
Sq Ft
$271/Sq Ft
Est. Value
About This Home
This home is located at 5868 Springport Rd, Jackson, MI 49201 and is currently estimated at $324,713, approximately $271 per square foot. 5868 Springport Rd is a home located in Jackson County with nearby schools including Northwest Early Elementary School, Northwest Elementary School, and Northwest Middle School.
Ownership History
Date
Name
Owned For
Owner Type
Purchase Details
Closed on
May 9, 2016
Sold by
Gardanier Richard E and Gardanier Stephanie M
Bought by
Gardanier Richard E
Current Estimated Value
Purchase Details
Closed on
Aug 31, 2009
Sold by
Schefferly Richard T and Schefferly Heidi L
Bought by
Gardanier Richard E and Gardanier Stephanie M
Home Financials for this Owner
Home Financials are based on the most recent Mortgage that was taken out on this home.
Original Mortgage
$100,000
Outstanding Balance
$65,698
Interest Rate
5.28%
Mortgage Type
New Conventional
Estimated Equity
$259,015
Purchase Details
Closed on
May 19, 1998
Sold by
Sparks Timothy J and Sparks Jan M
Bought by
Schefferly Richard T and Schefferly Heidi
Purchase Details
Closed on
May 8, 1998
Sold by
Scott George J and Scott Sandra
Bought by
Sparks Timothy J and Sparks Jan M
Create a Home Valuation Report for This Property
The Home Valuation Report is an in-depth analysis detailing your home's value as well as a comparison with similar homes in the area
Purchase History
| Date | Buyer | Sale Price | Title Company |
|---|---|---|---|
| Gardanier Richard E | -- | Attorney | |
| Gardanier Richard E | $142,000 | At | |
| Schefferly Richard T | -- | -- | |
| Sparks Timothy J | $9,000 | -- |
Source: Public Records
Mortgage History
| Date | Status | Borrower | Loan Amount |
|---|---|---|---|
| Open | Gardanier Richard E | $100,000 |
Source: Public Records
Tax History
| Year | Tax Paid | Tax Assessment Tax Assessment Total Assessment is a certain percentage of the fair market value that is determined by local assessors to be the total taxable value of land and additions on the property. | Land | Improvement |
|---|---|---|---|---|
| 2025 | $2,290 | $132,100 | $0 | $0 |
| 2024 | $11 | $129,300 | $0 | $0 |
| 2023 | $1,073 | $123,200 | $0 | $0 |
| 2022 | $2,077 | $109,700 | $0 | $0 |
| 2021 | $2,044 | $96,800 | $0 | $0 |
| 2020 | $2,026 | $95,700 | $0 | $0 |
| 2019 | $1,977 | $92,000 | $0 | $0 |
| 2018 | $1,954 | $80,400 | $0 | $0 |
| 2017 | $1,841 | $79,000 | $0 | $0 |
| 2016 | $1,760 | $79,016 | $0 | $79,016 |
| 2015 | $1,760 | $77,339 | $77,339 | $0 |
| 2014 | $1,760 | $72,726 | $72,726 | $0 |
| 2013 | -- | $72,726 | $72,726 | $0 |
Source: Public Records
Map
Nearby Homes
- 4350 Bailey Rd
- 6631 Springport Rd
- 4131 York Ln
- 4048 Knightsbridge Ln
- 6750 County Farm Rd
- 4845 Firethorne Dr
- 3992 Shoreham Dr
- 3249 Hendee Rd
- 0 Michigan 50
- 3884 Shoreham St
- 3363 Buckthorn Cir
- 3635 Hawthorn Dr
- 4211 Laurel
- 3995 Sherwood Lakes Blvd
- 3828 Idlewild St
- 0 Cummings Rd
- 2770 N Dearing Rd
- 2375 Windemere Dr
- 208 Glasgow Rd
- 3572 Clinton Way
- 5884 Springport Rd
- 5885 Springport Rd
- Par 5 Springport Rd
- Par 3 Springport Rd
- Par 4 Springport Rd
- Par A Springport Rd
- Par B Springport Rd
- 5732 Springport Rd
- 5735 Springport Rd
- 5735 Springport Rd
- 5701 Springport Rd
- 5650 Springport Rd
- 0000 Springport Rd
- 5995 Springport Rd
- 6123 Springport Rd
- 6005 Springport Rd
- 6005 Springport Rd
- 4727 Bennett Rd
- 4720 Bennett Rd
- 6180 Springport Rd
Your Personal Tour Guide
Ask me questions while you tour the home.