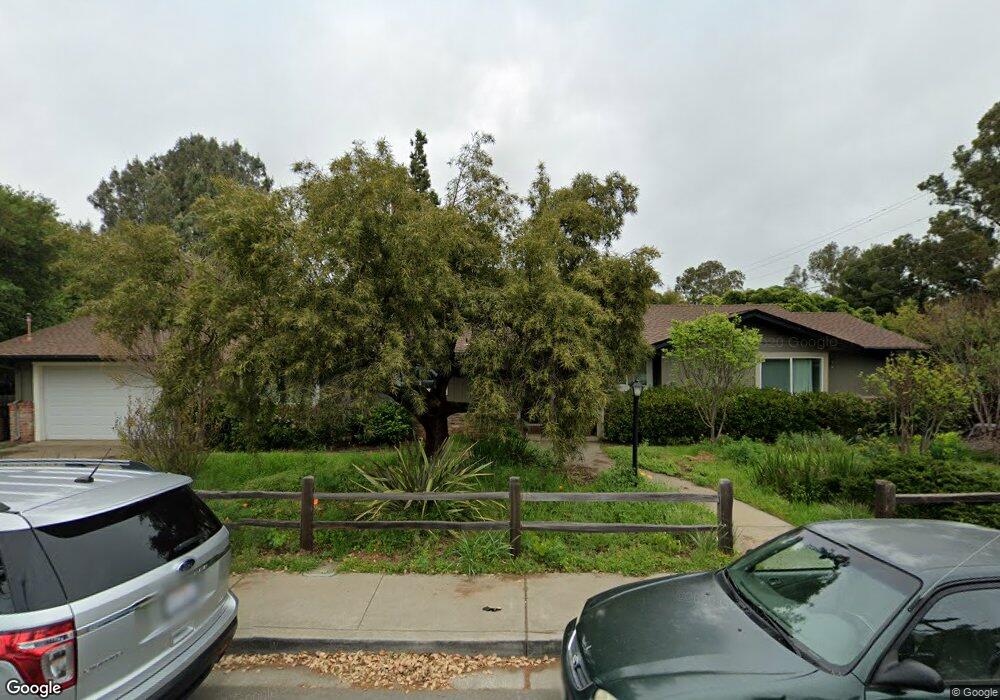
5869 Four Oaks Ln Clayton, CA 94517
Estimated Value: $940,496 - $1,002,000
3
Beds
3
Baths
1,649
Sq Ft
$589/Sq Ft
Est. Value
About This Home
This home is located at 5869 Four Oaks Ln, Clayton, CA 94517 and is currently estimated at $971,874, approximately $589 per square foot. 5869 Four Oaks Ln is a home located in Contra Costa County with nearby schools including Mt. Diablo Elementary School, Diablo View Middle School, and College Park High School.
Ownership History
Date
Name
Owned For
Owner Type
Purchase Details
Closed on
Feb 11, 2021
Sold by
Gallagher Matthew T and Gallagher Tristan H
Bought by
Gallagher Matthew T and Gallagher Tristan H
Current Estimated Value
Home Financials for this Owner
Home Financials are based on the most recent Mortgage that was taken out on this home.
Original Mortgage
$334,000
Outstanding Balance
$272,271
Interest Rate
2.65%
Mortgage Type
New Conventional
Estimated Equity
$699,603
Purchase Details
Closed on
May 23, 2012
Sold by
Jfb Properties Llc
Bought by
Gallagher Matthew T and Gallagher Tristen H
Home Financials for this Owner
Home Financials are based on the most recent Mortgage that was taken out on this home.
Original Mortgage
$400,000
Interest Rate
3.86%
Mortgage Type
New Conventional
Purchase Details
Closed on
Feb 17, 2012
Sold by
Kiehn Karen
Bought by
Jfb Properties Llc
Create a Home Valuation Report for This Property
The Home Valuation Report is an in-depth analysis detailing your home's value as well as a comparison with similar homes in the area
Home Values in the Area
Average Home Value in this Area
Purchase History
| Date | Buyer | Sale Price | Title Company |
|---|---|---|---|
| Gallagher Matthew T | -- | Fidelity National Title Co | |
| Gallagher Matthew T | $500,000 | Pacific Coast Title Company | |
| Jfb Properties Llc | $315,000 | Pacific Coast Title Company |
Source: Public Records
Mortgage History
| Date | Status | Borrower | Loan Amount |
|---|---|---|---|
| Open | Gallagher Matthew T | $334,000 | |
| Closed | Gallagher Matthew T | $400,000 |
Source: Public Records
Tax History Compared to Growth
Tax History
| Year | Tax Paid | Tax Assessment Tax Assessment Total Assessment is a certain percentage of the fair market value that is determined by local assessors to be the total taxable value of land and additions on the property. | Land | Improvement |
|---|---|---|---|---|
| 2025 | $7,955 | $628,017 | $270,046 | $357,971 |
| 2024 | $7,800 | $615,703 | $264,751 | $350,952 |
| 2023 | $7,800 | $603,631 | $259,560 | $344,071 |
| 2022 | $7,689 | $591,796 | $254,471 | $337,325 |
| 2021 | $7,497 | $580,193 | $249,482 | $330,711 |
| 2019 | $7,345 | $562,985 | $242,083 | $320,902 |
| 2018 | $7,067 | $551,947 | $237,337 | $314,610 |
| 2017 | $6,831 | $541,126 | $232,684 | $308,442 |
| 2016 | $6,643 | $530,517 | $228,122 | $302,395 |
| 2015 | $6,566 | $522,549 | $224,696 | $297,853 |
| 2014 | $6,452 | $512,314 | $220,295 | $292,019 |
Source: Public Records
Map
Nearby Homes
- 5900 High St
- 814 Chert Place
- 415 Chupcan Place Unit 3
- 1731 Indian Wells Way
- 931 Arrowhead Terrace
- 1338 Shell Ln
- 1221 Buckeye Terrace
- 5647 Southbrook Dr
- 1343 Shell Ln
- 337 Saclan Terrace
- 1290 Easley Dr
- 5872 Herriman Dr
- 5665 Lewis Way
- 1170 Ridgemont Place
- 1816 Eagle Peak Ave
- 5555 Alabama Dr
- 1224 Easley Dr
- 1498 Delaware Dr
- 5540 Michigan Blvd
- 1835 Camino Estrada
- 5869 Four Oaks Ln
- 5868 Four Oaks Ln
- 5887 Mt Zion Dr
- 5860 Clayton Rd
- 5862 Four Oaks Ln
- 5856 Four Oaks Ln
- 5869 Pine Hollow Rd
- 5843 Four Oaks Ln
- 5863 Pine Hollow Rd
- 1212 Mitchell Canyon Rd
- 5850 Four Oaks Ln
- 5857 Pine Hollow Rd
- 5859 Clayton Rd
- 5851 Pine Hollow Rd
- 5962 Wallace Dr
- 5841 Four Oaks Ln
- 5858 Pine Hollow Rd
- 1046 Tiffin Dr
- 5856 Pine Hollow Rd
- 5838 Four Oaks Ln