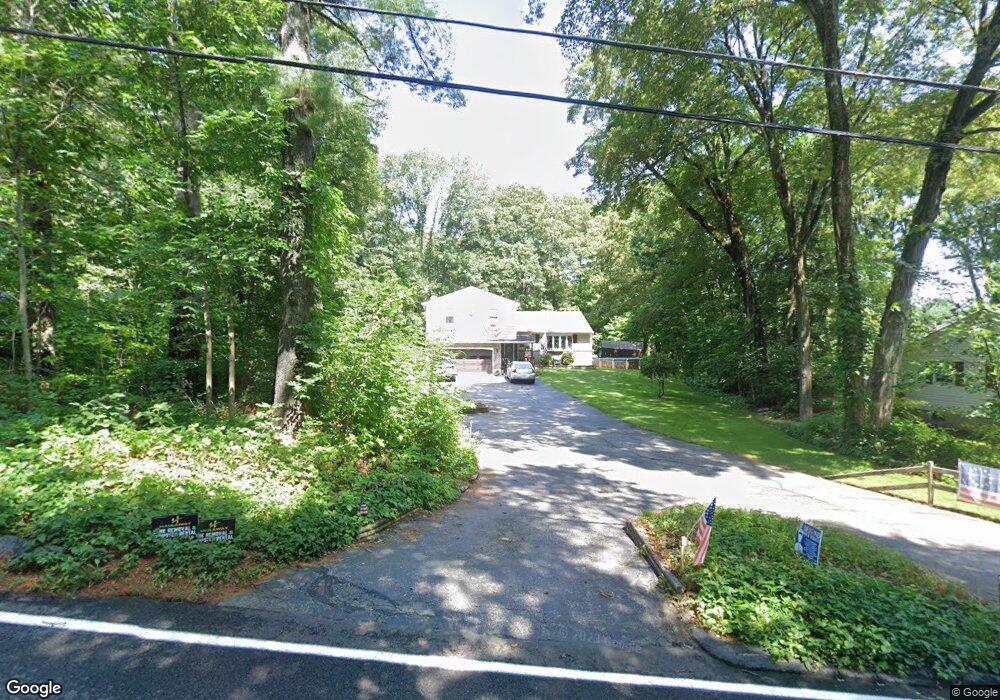
587 Benson Rd Northbridge, MA 01534
Estimated Value: $520,970 - $591,000
4
Beds
3
Baths
1,824
Sq Ft
$305/Sq Ft
Est. Value
About This Home
This home is located at 587 Benson Rd, Northbridge, MA 01534 and is currently estimated at $556,493, approximately $305 per square foot. 587 Benson Rd is a home located in Worcester County with nearby schools including Northbridge Elementary School, Northbridge Middle School, and Northbridge High School.
Ownership History
Date
Name
Owned For
Owner Type
Purchase Details
Closed on
May 6, 2019
Sold by
Massicotte Peter M and Massicotte Sandra J
Bought by
Massicotte Ft 2019 and Massicotte
Current Estimated Value
Purchase Details
Closed on
Jun 13, 1985
Bought by
Massicotte Peter M
Create a Home Valuation Report for This Property
The Home Valuation Report is an in-depth analysis detailing your home's value as well as a comparison with similar homes in the area
Home Values in the Area
Average Home Value in this Area
Purchase History
| Date | Buyer | Sale Price | Title Company |
|---|---|---|---|
| Massicotte Ft 2019 | -- | -- | |
| Massicotte Ft 2019 | -- | -- | |
| Massicotte Ft 2019 | -- | -- | |
| Massicotte Peter M | -- | -- |
Source: Public Records
Mortgage History
| Date | Status | Borrower | Loan Amount |
|---|---|---|---|
| Previous Owner | Massicotte Peter M | $30,000 |
Source: Public Records
Tax History
| Year | Tax Paid | Tax Assessment Tax Assessment Total Assessment is a certain percentage of the fair market value that is determined by local assessors to be the total taxable value of land and additions on the property. | Land | Improvement |
|---|---|---|---|---|
| 2025 | $5,227 | $443,300 | $154,700 | $288,600 |
| 2024 | $5,084 | $420,500 | $154,700 | $265,800 |
| 2023 | $5,306 | $409,400 | $154,700 | $254,700 |
| 2022 | $5,142 | $373,400 | $119,100 | $254,300 |
| 2021 | $5,021 | $346,500 | $113,400 | $233,100 |
| 2020 | $6,209 | $336,800 | $113,400 | $223,400 |
| 2019 | $4,211 | $324,700 | $113,400 | $211,300 |
| 2018 | $4,005 | $309,500 | $107,900 | $201,600 |
| 2017 | $5,093 | $295,000 | $107,900 | $187,100 |
| 2016 | $3,726 | $271,000 | $98,100 | $172,900 |
| 2015 | $3,626 | $271,000 | $98,100 | $172,900 |
| 2014 | $3,593 | $271,000 | $98,100 | $172,900 |
Source: Public Records
Map
Nearby Homes
- 659 Highland St
- 90 Windstone Dr
- 5 S Main St
- 0 Puddon St
- 69-71 Providence Rd
- 86 Kingsnorth St
- 1825 Quaker St
- 2248 Providence Rd
- 81 Rebecca Rd
- 2294 Providence Rd
- 140 Rolling Ridge Dr Unit 78
- 135 Rolling Ridge Dr Unit 56
- 161 Rolling Ridge Dr Unit 93
- 35 School St Unit 35
- 3 Mendon Rd
- 165 Rolling Ridge Dr Unit 95
- 4 Mendon Rd
- 169 Rolling Ridge Dr Unit 97
- 167 Rolling Ridge Dr Unit 96
- 59 Crestwood Cir Unit 39
Your Personal Tour Guide
Ask me questions while you tour the home.