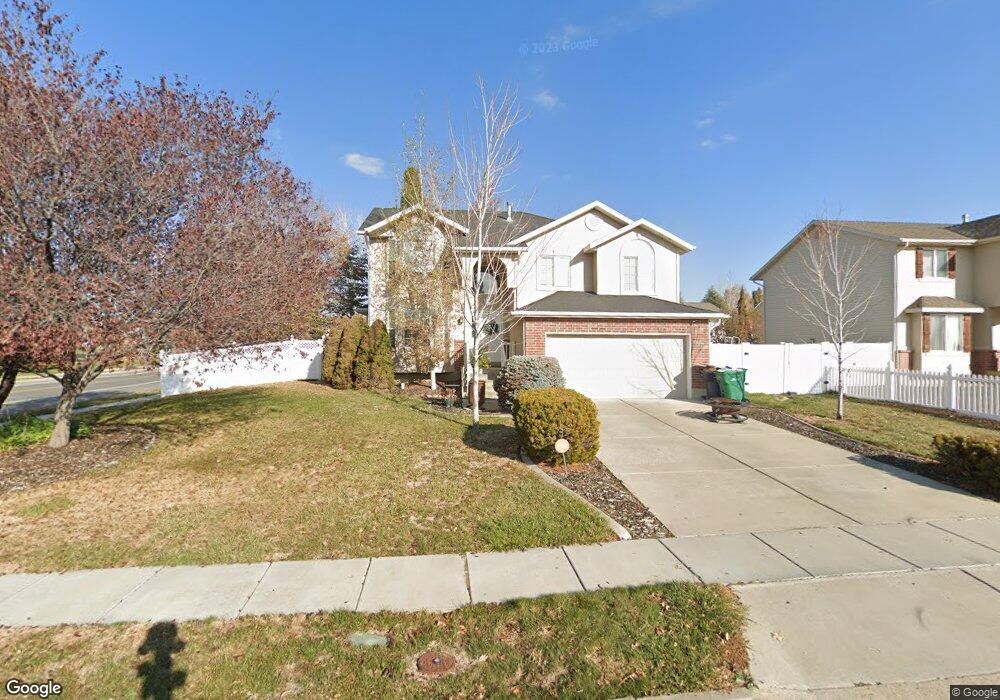
587 E 2100 S Clearfield, UT 84015
Estimated Value: $509,580 - $562,000
5
Beds
3
Baths
2,396
Sq Ft
$223/Sq Ft
Est. Value
About This Home
This home is located at 587 E 2100 S, Clearfield, UT 84015 and is currently estimated at $534,395, approximately $223 per square foot. 587 E 2100 S is a home located in Davis County with nearby schools including Antelope Elementary School, North Davis Junior High School, and Clearfield High School.
Ownership History
Date
Name
Owned For
Owner Type
Purchase Details
Closed on
Jan 29, 2018
Sold by
Decker Steven
Bought by
Ah4r Properties Llc
Current Estimated Value
Purchase Details
Closed on
Sep 19, 2011
Sold by
Lee Mike D and Lee Heidi A
Bought by
Decker Steven
Home Financials for this Owner
Home Financials are based on the most recent Mortgage that was taken out on this home.
Original Mortgage
$195,904
Interest Rate
4.4%
Mortgage Type
FHA
Purchase Details
Closed on
Dec 20, 2005
Sold by
Capener Daniel L and Capener Janice Kuang
Bought by
Lee Mike D and Lee Heidi A
Purchase Details
Closed on
Jul 30, 2003
Sold by
Ricks Dennis and Ricks Kathryn
Bought by
Capener Daniel L and Capener Janice Kuang
Home Financials for this Owner
Home Financials are based on the most recent Mortgage that was taken out on this home.
Original Mortgage
$218,400
Interest Rate
5.13%
Mortgage Type
Purchase Money Mortgage
Purchase Details
Closed on
Aug 21, 2001
Sold by
Keepsake Homes Llc
Bought by
Ricks Dennis and Ricks Kathryn
Create a Home Valuation Report for This Property
The Home Valuation Report is an in-depth analysis detailing your home's value as well as a comparison with similar homes in the area
Home Values in the Area
Average Home Value in this Area
Purchase History
| Date | Buyer | Sale Price | Title Company |
|---|---|---|---|
| Ah4r Properties Llc | -- | Hickman Land Title | |
| Decker Steven | -- | Metro National Title | |
| Lee Mike D | -- | First American Title | |
| Capener Daniel L | -- | Bonneville Title Company Inc | |
| Ricks Dennis | -- | Bonneville Title Company Inc |
Source: Public Records
Mortgage History
| Date | Status | Borrower | Loan Amount |
|---|---|---|---|
| Previous Owner | Decker Steven | $195,904 | |
| Previous Owner | Capener Daniel L | $218,400 |
Source: Public Records
Tax History
| Year | Tax Paid | Tax Assessment Tax Assessment Total Assessment is a certain percentage of the fair market value that is determined by local assessors to be the total taxable value of land and additions on the property. | Land | Improvement |
|---|---|---|---|---|
| 2025 | $3,044 | $272,800 | $74,197 | $198,603 |
| 2024 | $2,943 | $265,649 | $70,894 | $194,755 |
| 2023 | $2,704 | $246,400 | $62,086 | $184,313 |
| 2022 | $2,793 | $455,000 | $116,560 | $338,440 |
| 2021 | $2,526 | $342,000 | $71,052 | $270,948 |
| 2020 | $2,320 | $312,000 | $60,303 | $251,697 |
| 2019 | $2,230 | $296,000 | $64,414 | $231,586 |
| 2018 | $2,088 | $270,000 | $57,174 | $212,826 |
| 2016 | $1,829 | $123,640 | $23,041 | $100,599 |
| 2015 | $1,792 | $115,500 | $23,041 | $92,459 |
| 2014 | $1,841 | $120,238 | $23,041 | $97,197 |
| 2013 | -- | $103,519 | $29,480 | $74,039 |
Source: Public Records
Map
Nearby Homes
- 668 E 2000 S
- 1477 N 2375 W
- 308 E 1925 S
- 460 E 1700 S Unit 1 & 2
- 1250 N 2925 W
- 195 E 2325 S
- 1430 N 2100 W
- 154 E 2325 S
- 1141 N 2275 W
- 1916 N Celia Way
- 1491 N 1875 W
- 1491 N 1875 W Unit 158
- 1487 N 1875 W
- 1487 N 1875 W Unit 159
- 1483 N 1875 W
- 1479 N 1875 W
- 1479 N 1875 W Unit 161
- 1475 N 1875 W
- 1471 N 1875 W
- 1471 N 1875 W Unit 163
Your Personal Tour Guide
Ask me questions while you tour the home.