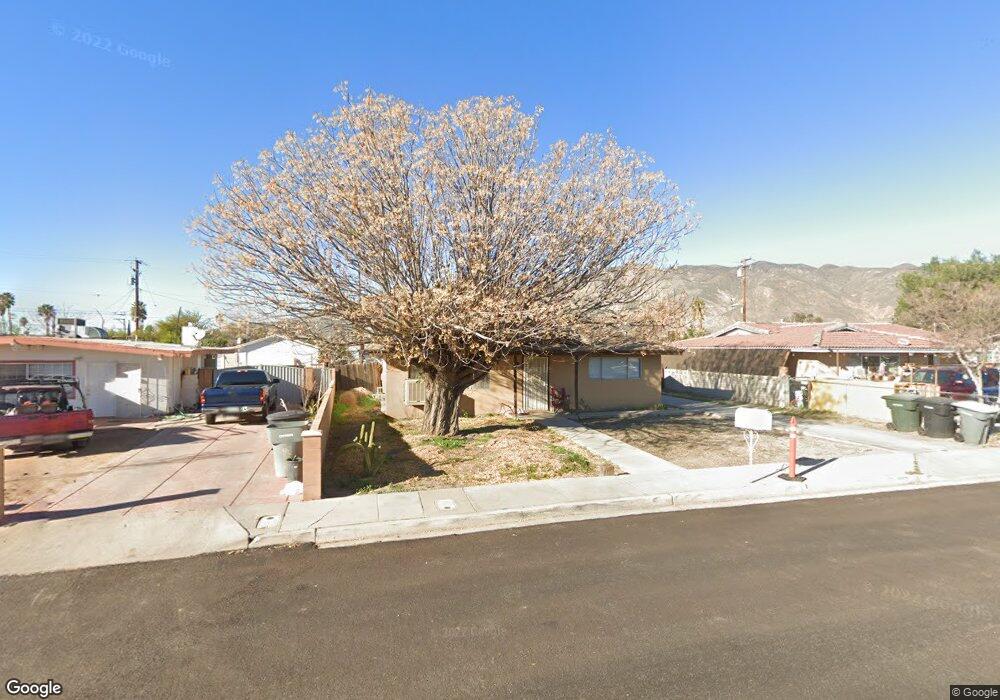
587 E 2nd St San Jacinto, CA 92583
Heritage NeighborhoodEstimated Value: $276,000 - $383,000
2
Beds
1
Bath
925
Sq Ft
$356/Sq Ft
Est. Value
About This Home
This home is located at 587 E 2nd St, San Jacinto, CA 92583 and is currently estimated at $329,416, approximately $356 per square foot. 587 E 2nd St is a home located in Riverside County with nearby schools including Estudillo Elementary School, Monte Vista Middle School, and San Jacinto High School.
Ownership History
Date
Name
Owned For
Owner Type
Purchase Details
Closed on
Dec 12, 2020
Sold by
Guzman Isidro and Guzman Connie O
Bought by
Guzman Isidro and Guzman Connie O
Current Estimated Value
Purchase Details
Closed on
Jan 30, 2009
Sold by
Toft Steven R and Toft Jennifer
Bought by
Guzman Greg A and Guzman Isidro
Home Financials for this Owner
Home Financials are based on the most recent Mortgage that was taken out on this home.
Original Mortgage
$45,657
Outstanding Balance
$28,830
Interest Rate
5.08%
Mortgage Type
FHA
Estimated Equity
$300,586
Purchase Details
Closed on
Jan 11, 2008
Sold by
Toft Steven R
Bought by
Toft Steven R and Toft Jennifer
Purchase Details
Closed on
Oct 1, 1992
Sold by
Heggen Robert D
Bought by
Toft Roger D
Home Financials for this Owner
Home Financials are based on the most recent Mortgage that was taken out on this home.
Original Mortgage
$16,973
Interest Rate
7.21%
Mortgage Type
Seller Take Back
Create a Home Valuation Report for This Property
The Home Valuation Report is an in-depth analysis detailing your home's value as well as a comparison with similar homes in the area
Home Values in the Area
Average Home Value in this Area
Purchase History
| Date | Buyer | Sale Price | Title Company |
|---|---|---|---|
| Guzman Isidro | -- | None Available | |
| Guzman Greg A | $46,500 | First American Title Company | |
| Toft Steven R | -- | None Available | |
| Toft Roger D | $24,500 | Fidelity National Title Ins | |
| Heggen Robert D | -- | Fidelity National Title Co |
Source: Public Records
Mortgage History
| Date | Status | Borrower | Loan Amount |
|---|---|---|---|
| Open | Guzman Greg A | $45,657 | |
| Previous Owner | Toft Roger D | $16,973 |
Source: Public Records
Tax History
| Year | Tax Paid | Tax Assessment Tax Assessment Total Assessment is a certain percentage of the fair market value that is determined by local assessors to be the total taxable value of land and additions on the property. | Land | Improvement |
|---|---|---|---|---|
| 2025 | $1,134 | $59,859 | $25,743 | $34,116 |
| 2023 | $1,134 | $57,538 | $24,745 | $32,793 |
| 2022 | $684 | $56,410 | $24,260 | $32,150 |
| 2021 | $672 | $55,305 | $23,785 | $31,520 |
| 2020 | $1,046 | $54,739 | $23,542 | $31,197 |
| 2019 | $1,013 | $53,667 | $23,081 | $30,586 |
| 2018 | $959 | $52,616 | $22,631 | $29,985 |
| 2017 | $773 | $51,586 | $22,188 | $29,398 |
| 2016 | $607 | $50,575 | $21,753 | $28,822 |
| 2015 | $599 | $49,817 | $21,427 | $28,390 |
| 2014 | $795 | $48,843 | $21,008 | $27,835 |
Source: Public Records
Map
Nearby Homes
- 565 E Main St
- 655 E Main St Unit 83
- 655 E Main St Unit 60
- 655 E Main St
- 655 E Main St Unit 29
- 655 E Main St Unit 62
- 655 E Main St Unit 9
- 445 E Main St
- 427 E Main St
- 0 S Rosario Ave
- 40560 Artesia St
- 397 E Main St
- 501 S Mistletoe Ave Unit 19
- 501 S Mistletoe Ave Unit 16
- 501 S Mistletoe Ave Unit 18
- 501 S Mistletoe Ave Unit 17
- 454 S Rosario Ave
- 0 N Jordan Ave Unit 219144335DA
- 455 E 7th St Unit 63
- 455 E 7th St Unit 24
- 593 E 2nd St
- 579 E 2nd St
- 2nd St
- 571 E 2nd St
- 180 S Vernon Ave
- 156 S Vernon Ave
- 210 S Vernon Ave
- 574 E Mead St
- 213 Mistletoe Ave
- 262 Mistletoe Ave
- 740 Petunia Rd
- 413 Poplar Hill
- 303 Basswood Way
- 222 Mistletoe Ave
- 243 Mistletoe Ave
- 267 Scarlet Oak Ln
- 448 Cherokee Rose Dr
- 442 Cherokee Rose Dr
- 408 Poplar Hill
- 770 Petunia Rd
Your Personal Tour Guide
Ask me questions while you tour the home.