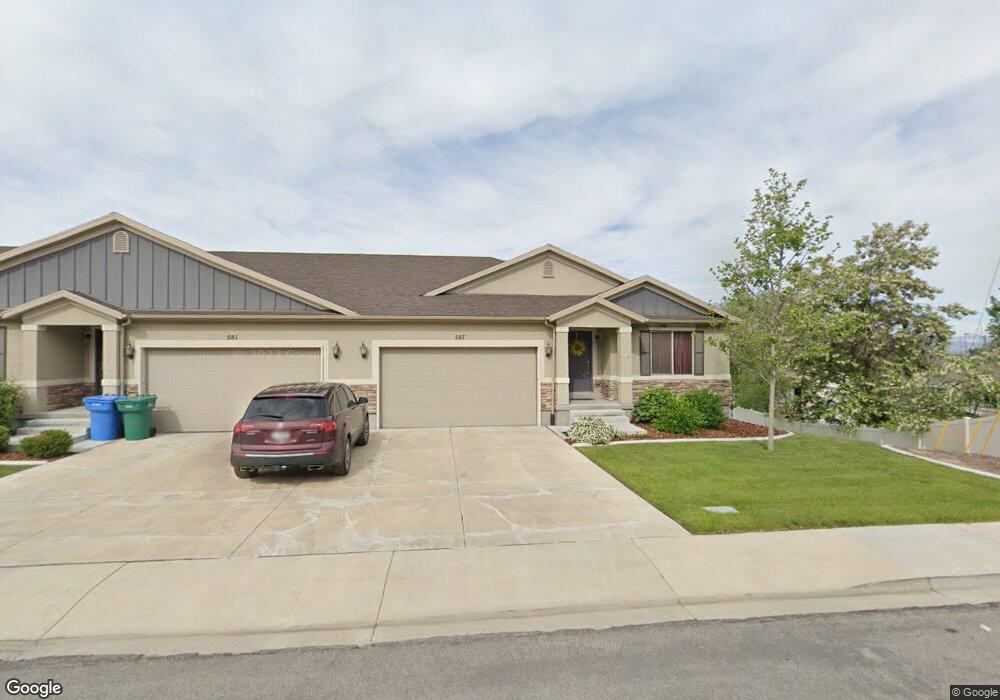
587 N 1060 W Orem, UT 84057
Geneva NeighborhoodEstimated Value: $457,000 - $482,000
3
Beds
2
Baths
2,804
Sq Ft
$169/Sq Ft
Est. Value
About This Home
This home is located at 587 N 1060 W, Orem, UT 84057 and is currently estimated at $472,730, approximately $168 per square foot. 587 N 1060 W is a home located in Utah County with nearby schools including Orem Junior High School, Timpanogos High School, and Franklin Discovery Academy.
Ownership History
Date
Name
Owned For
Owner Type
Purchase Details
Closed on
Sep 4, 2015
Sold by
Parry Melinda
Bought by
Parry Melinda C
Current Estimated Value
Home Financials for this Owner
Home Financials are based on the most recent Mortgage that was taken out on this home.
Original Mortgage
$144,523
Outstanding Balance
$57,821
Interest Rate
3.91%
Mortgage Type
New Conventional
Estimated Equity
$414,909
Purchase Details
Closed on
Aug 2, 2011
Sold by
D R Horton Inc
Bought by
Parry Melinda
Home Financials for this Owner
Home Financials are based on the most recent Mortgage that was taken out on this home.
Original Mortgage
$161,490
Interest Rate
4.48%
Mortgage Type
New Conventional
Create a Home Valuation Report for This Property
The Home Valuation Report is an in-depth analysis detailing your home's value as well as a comparison with similar homes in the area
Home Values in the Area
Average Home Value in this Area
Purchase History
| Date | Buyer | Sale Price | Title Company |
|---|---|---|---|
| Parry Melinda C | -- | North American Title | |
| Parry Melinda | -- | Provo Land Title Company |
Source: Public Records
Mortgage History
| Date | Status | Borrower | Loan Amount |
|---|---|---|---|
| Open | Parry Melinda C | $144,523 | |
| Closed | Parry Melinda | $161,490 |
Source: Public Records
Tax History
| Year | Tax Paid | Tax Assessment Tax Assessment Total Assessment is a certain percentage of the fair market value that is determined by local assessors to be the total taxable value of land and additions on the property. | Land | Improvement |
|---|---|---|---|---|
| 2025 | $2,153 | $252,120 | -- | -- |
| 2024 | $1,959 | $263,285 | $0 | $0 |
| 2023 | $1,959 | $257,400 | $0 | $0 |
| 2022 | $2,035 | $259,160 | $0 | $0 |
| 2021 | $1,851 | $357,000 | $85,000 | $272,000 |
| 2020 | $1,744 | $330,600 | $85,000 | $245,600 |
| 2019 | $1,522 | $300,000 | $85,000 | $215,000 |
| 2018 | $1,400 | $263,700 | $85,000 | $178,700 |
| 2017 | $1,410 | $142,285 | $0 | $0 |
| 2016 | $1,214 | $112,970 | $0 | $0 |
| 2015 | $1,238 | $108,900 | $0 | $0 |
| 2014 | $1,130 | $99,000 | $0 | $0 |
Source: Public Records
Map
Nearby Homes
- 1058 W 570 St N
- 1094 W 465 N
- 954 W 630 N Unit 34,
- 1004 W 400 N
- 875 W 530 N
- 686 N 835 W
- 803 W 530 N
- 222 N 1200 W Unit 144
- 222 N 1200 W Unit 84
- 277 N 1030 W
- 489 N Beverly Ave
- 557 N Emery Ave
- 930 N 980 W
- 1140 W 950 N Unit D302
- 1140 W 950 N Unit E202
- 1140 W 950 N Unit D304
- 474 N Emery Ave
- 1004 N 1090 W Unit 203
- 1225 W 160 N
- 1069 N 1160 W
Your Personal Tour Guide
Ask me questions while you tour the home.