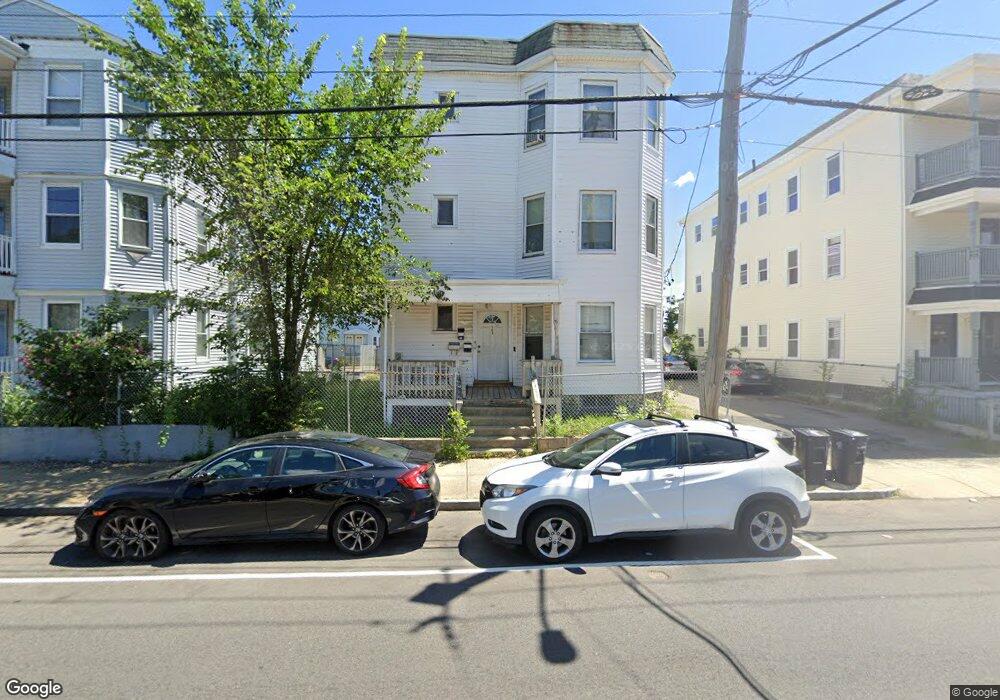
587 N Main St Brockton, MA 02301
Montello NeighborhoodEstimated Value: $587,244 - $945,000
9
Beds
3
Baths
3,732
Sq Ft
$205/Sq Ft
Est. Value
About This Home
This home is located at 587 N Main St, Brockton, MA 02301 and is currently estimated at $765,311, approximately $205 per square foot. 587 N Main St is a home located in Plymouth County with nearby schools including Louis F Angelo Elementary School, Raymond K-8 Elementary School, and Manthala George Jr. School.
Ownership History
Date
Name
Owned For
Owner Type
Purchase Details
Closed on
Oct 4, 2010
Sold by
Depina Bruno
Bought by
Depina Mario and Depina Caterina
Current Estimated Value
Purchase Details
Closed on
Aug 3, 2010
Sold by
Fnma
Bought by
Depina Bruno
Purchase Details
Closed on
May 28, 2010
Sold by
Ejiofor Charles O
Bought by
Federal National Mortgage Association
Purchase Details
Closed on
Feb 6, 2002
Sold by
Desjarlais Andrew and Desjarlais Michael
Bought by
Ejiofor Charles O
Home Financials for this Owner
Home Financials are based on the most recent Mortgage that was taken out on this home.
Original Mortgage
$220,356
Interest Rate
7.13%
Mortgage Type
Purchase Money Mortgage
Create a Home Valuation Report for This Property
The Home Valuation Report is an in-depth analysis detailing your home's value as well as a comparison with similar homes in the area
Home Values in the Area
Average Home Value in this Area
Purchase History
| Date | Buyer | Sale Price | Title Company |
|---|---|---|---|
| Depina Mario | -- | -- | |
| Depina Bruno | -- | -- | |
| Federal National Mortgage Association | $295,813 | -- | |
| Ejiofor Charles O | $224,000 | -- |
Source: Public Records
Mortgage History
| Date | Status | Borrower | Loan Amount |
|---|---|---|---|
| Previous Owner | Ejiofor Charles O | $280,000 | |
| Previous Owner | Ejiofor Charles O | $264,000 | |
| Previous Owner | Ejiofor Charles O | $220,356 |
Source: Public Records
Tax History Compared to Growth
Tax History
| Year | Tax Paid | Tax Assessment Tax Assessment Total Assessment is a certain percentage of the fair market value that is determined by local assessors to be the total taxable value of land and additions on the property. | Land | Improvement |
|---|---|---|---|---|
| 2025 | $8,420 | $695,300 | $131,600 | $563,700 |
| 2024 | $7,734 | $643,400 | $131,600 | $511,800 |
| 2023 | $6,343 | $488,700 | $99,500 | $389,200 |
| 2022 | $6,302 | $451,100 | $90,000 | $361,100 |
| 2021 | $5,630 | $388,300 | $74,100 | $314,200 |
| 2020 | $4,984 | $329,000 | $70,400 | $258,600 |
| 2019 | $5,113 | $329,000 | $67,100 | $261,900 |
| 2018 | $4,291 | $267,200 | $67,100 | $200,100 |
| 2017 | $4,725 | $293,500 | $67,100 | $226,400 |
| 2016 | $4,196 | $241,700 | $65,000 | $176,700 |
| 2015 | $3,205 | $176,600 | $65,000 | $111,600 |
| 2014 | $2,926 | $161,400 | $65,000 | $96,400 |
Source: Public Records
Map
Nearby Homes
- 560 N Montello St
- 39 Upland Rd
- 95 Battles St
- 0 Vine St
- 24 E Ashland St
- 77 Porter St
- 115 Ames St
- 35 Huntington St
- 731 N Montello St Unit 6
- 39 Huntington St
- 112 Ames St
- 737 N Montello St
- 144 Ames St
- 20 Johnson Ct
- 30 Intervale St
- 90 Cherry St
- 69 Beacon Park
- 0 Prospect St
- 29 Saint Casimir Ave
- 10 Fitzpatrick Ave
- 591 N Main St
- 50 E Main St
- 44 E Main St
- 607 N Main St
- 582 N Main St
- 55 E Main St
- 45 E Main St
- 45 E Main St Unit 3
- 592 N Main St
- 578 N Main St
- 34 E Main St Unit 2 South
- 34 E Main St Unit 2 North
- 34 E Main St
- 567 N Main St
- 574 N Main St
- 574 N Main St Unit 1
- 61 E Main St
- 49 E Main St
- 11 Annis Ave
- 568 Main St