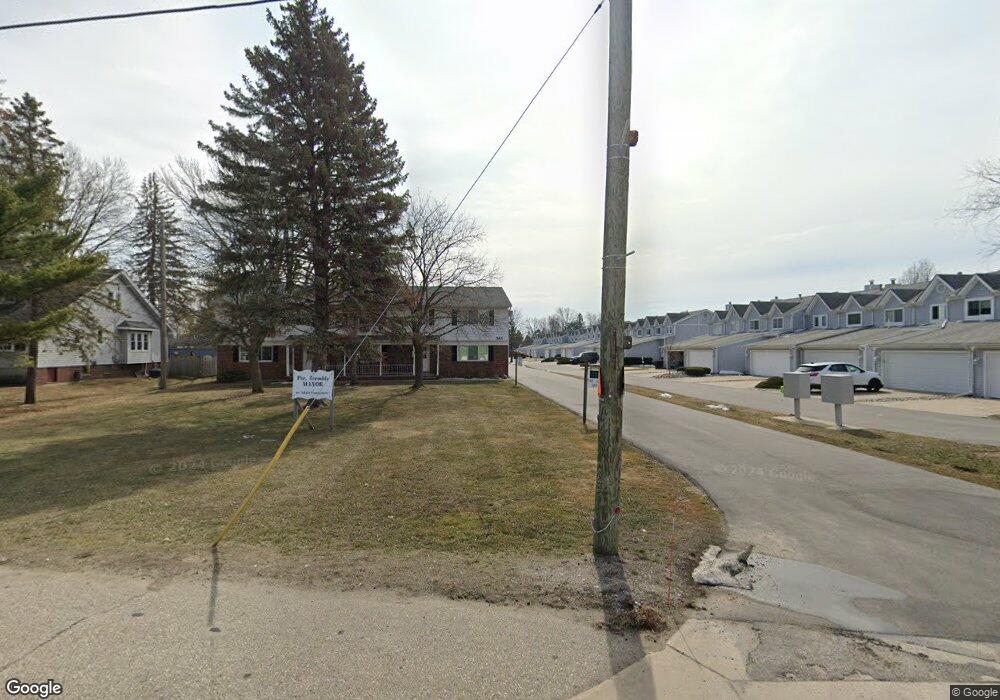
587 Pointe Tremble Rd Algonac, MI 48001
Estimated Value: $72,000 - $117,000
Studio
--
Bath
--
Sq Ft
--
Built
About This Home
This home is located at 587 Pointe Tremble Rd, Algonac, MI 48001 and is currently estimated at $88,433. 587 Pointe Tremble Rd is a home located in St. Clair County.
Ownership History
Date
Name
Owned For
Owner Type
Purchase Details
Closed on
Jan 10, 2020
Sold by
Weber Michael J
Bought by
Saddler Ora David
Current Estimated Value
Home Financials for this Owner
Home Financials are based on the most recent Mortgage that was taken out on this home.
Original Mortgage
$38,700
Interest Rate
3.1%
Mortgage Type
New Conventional
Purchase Details
Closed on
Dec 20, 2019
Sold by
Weber Michael J
Bought by
Saddler Ora David
Home Financials for this Owner
Home Financials are based on the most recent Mortgage that was taken out on this home.
Original Mortgage
$38,700
Interest Rate
3.1%
Mortgage Type
New Conventional
Purchase Details
Closed on
May 27, 2008
Sold by
Ryniak Helen and Ryniak Paul
Bought by
Ryniak Helen and Weber Patricia A
Home Financials for this Owner
Home Financials are based on the most recent Mortgage that was taken out on this home.
Original Mortgage
$43,464
Interest Rate
6.01%
Mortgage Type
New Conventional
Create a Home Valuation Report for This Property
The Home Valuation Report is an in-depth analysis detailing your home's value as well as a comparison with similar homes in the area
Home Values in the Area
Average Home Value in this Area
Purchase History
| Date | Buyer | Sale Price | Title Company |
|---|---|---|---|
| Saddler Ora David | -- | New Title Company Name | |
| Weber Michael J | -- | New Title Company Name | |
| Saddler Ora David | $45,000 | Jb Title | |
| Saddler Ora David | -- | New Title Company Name | |
| Ryniak Helen | -- | None Available |
Source: Public Records
Mortgage History
| Date | Status | Borrower | Loan Amount |
|---|---|---|---|
| Previous Owner | Saddler Ora David | $38,700 | |
| Previous Owner | Ryniak Helen | $43,464 |
Source: Public Records
Tax History
| Year | Tax Paid | Tax Assessment Tax Assessment Total Assessment is a certain percentage of the fair market value that is determined by local assessors to be the total taxable value of land and additions on the property. | Land | Improvement |
|---|---|---|---|---|
| 2025 | $879 | $29,100 | $0 | $0 |
| 2024 | $1,130 | $24,300 | $0 | $0 |
| 2023 | $1,064 | $22,800 | $0 | $0 |
| 2022 | $1,078 | $20,100 | $0 | $0 |
| 2020 | $1,074 | $18,900 | $0 | $18,900 |
| 2019 | $596 | $17,300 | $0 | $0 |
| 2018 | $584 | $17,700 | $0 | $0 |
| 2017 | $549 | $21,500 | $0 | $0 |
| 2016 | $504 | $21,500 | $0 | $0 |
| 2015 | -- | $14,500 | $0 | $14,500 |
| 2014 | -- | $14,600 | $0 | $14,600 |
| 2013 | -- | $14,800 | $0 | $0 |
Source: Public Records
Map
Nearby Homes
- 710 Ruskin Ave
- 724 Townsend Dr
- 429 Edgewater Dr
- 304 Kama Ct
- 468 Russell Rd
- 919 Smith St
- 9642 Nook Rd Unit 7
- 1103 Beth Ct
- 374 Monroe Blvd
- 1523 Saint Clair River Dr
- 0 N Channel Dr Unit 50172349
- 1516 Saint Clair River Dr
- 1609 Saint Clair River Dr
- 1719 Saint Clair River Dr
- 130 Delta Dr
- 114 Interlochen Dr
- 1806 Michigan St
- 142 Channel Syde Dr
- 3202 Fruit St
- 474 South St
- 587 Pointe Tremble Rd
- 587 Pointe Tremble Rd
- 587 Pointe Tremble Rd
- 587 Pointe Tremble Rd
- 587 Pointe Tremble Rd Unit 11 -
- 587 Pointe Tremble Rd
- 587 Pointe Tremble Rd Unit 12
- 587 Pointe Tremble Rd Unit 4
- 587 Pointe Tremble Rd Unit 4
- 587 Pointe Tremble Rd Unit Building 2
- 587 Pointe Tremble #4
- 587 Pointe Tremble #6
- 589 Pointe Tremble Rd
- 589 Pointe Tremble Rd
- 589 Pointe Tremble Rd
- 589 Pointe Tremble Rd
- 589 Pointe Tremble Rd Unit 6
- 589 Pointe Tremble Rd
- 589 Pointe Tremble Rd
- 589 Pointe Tremble Rd Unit 14
Your Personal Tour Guide
Ask me questions while you tour the home.