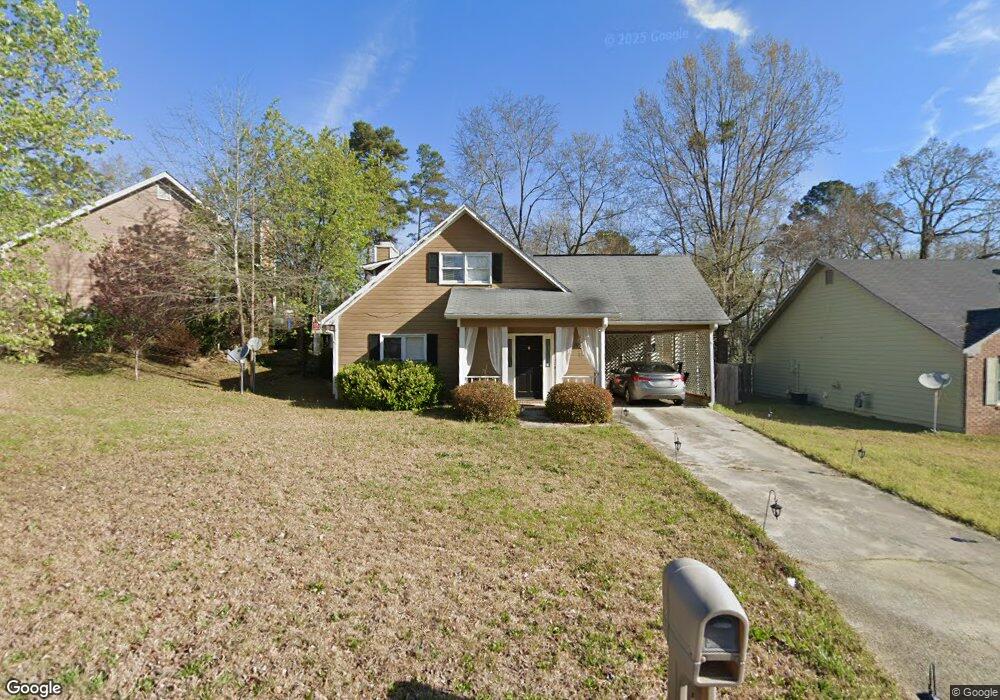
587 Shadow Moss Dr Unit 108-9 Macon, GA 31204
Estimated Value: $176,637 - $199,000
3
Beds
2
Baths
1,741
Sq Ft
$108/Sq Ft
Est. Value
About This Home
This home is located at 587 Shadow Moss Dr Unit 108-9, Macon, GA 31204 and is currently estimated at $188,409, approximately $108 per square foot. 587 Shadow Moss Dr Unit 108-9 is a home located in Bibb County with nearby schools including Rosa Taylor Elementary School, Miller Fine Arts Magnet Middle School, and Central High School.
Ownership History
Date
Name
Owned For
Owner Type
Purchase Details
Closed on
Jul 20, 2018
Sold by
Driggers Properties Llc
Bought by
Taylor Ryan A
Current Estimated Value
Home Financials for this Owner
Home Financials are based on the most recent Mortgage that was taken out on this home.
Original Mortgage
$85,476
Outstanding Balance
$74,078
Interest Rate
4.5%
Mortgage Type
New Conventional
Estimated Equity
$114,331
Purchase Details
Closed on
Nov 20, 2007
Sold by
Baston Jonathan D and Baston Stephanie S
Bought by
Driggers Properties Llc
Home Financials for this Owner
Home Financials are based on the most recent Mortgage that was taken out on this home.
Original Mortgage
$110,763
Interest Rate
6.29%
Mortgage Type
Purchase Money Mortgage
Purchase Details
Closed on
May 25, 1999
Create a Home Valuation Report for This Property
The Home Valuation Report is an in-depth analysis detailing your home's value as well as a comparison with similar homes in the area
Home Values in the Area
Average Home Value in this Area
Purchase History
| Date | Buyer | Sale Price | Title Company |
|---|---|---|---|
| Taylor Ryan A | $89,975 | None Available | |
| Driggers Properties Llc | $108,000 | None Available | |
| -- | $91,500 | -- |
Source: Public Records
Mortgage History
| Date | Status | Borrower | Loan Amount |
|---|---|---|---|
| Open | Taylor Ryan A | $85,476 | |
| Previous Owner | Driggers Properties Llc | $110,763 |
Source: Public Records
Tax History Compared to Growth
Tax History
| Year | Tax Paid | Tax Assessment Tax Assessment Total Assessment is a certain percentage of the fair market value that is determined by local assessors to be the total taxable value of land and additions on the property. | Land | Improvement |
|---|---|---|---|---|
| 2024 | $1,443 | $56,822 | $6,000 | $50,822 |
| 2023 | $1,299 | $51,128 | $6,000 | $45,128 |
| 2022 | $1,711 | $49,424 | $6,600 | $42,824 |
| 2021 | $1,599 | $42,090 | $6,000 | $36,090 |
| 2020 | $1,477 | $38,050 | $6,000 | $32,050 |
| 2019 | $1,409 | $38,050 | $6,000 | $32,050 |
| 2018 | $2,255 | $34,619 | $6,000 | $28,619 |
| 2017 | $1,252 | $33,416 | $4,797 | $28,619 |
| 2016 | $1,331 | $38,467 | $4,797 | $33,670 |
| 2015 | $1,884 | $38,467 | $4,797 | $33,670 |
| 2014 | $2,166 | $38,467 | $4,797 | $33,670 |
Source: Public Records
Map
Nearby Homes
- 3341 Stinsonville Rd
- 3096 Stuart Dr
- 759 Mosby Ct
- 3687 Overlook Dr
- 3687 Overlook Ave
- 803 Captain Kell Dr
- 3823 Overlook Ave
- 3790 Overlook Ave
- 3175 Stinsonville Rd
- 2956 Malvern Hill Dr
- 2939 General Lee Rd
- 3182 Highpoint Dr
- 613 Rosa Taylor Dr
- 620 Rosa Taylor Dr
- 2925 Malvern Hill Dr
- 509 Sugarloaf Dr
- 946 Fair Oaks Dr
- 3408 Ridge Ave
- 209 Forest Hill Rd
- 227 Forest Hill Rd
- 587 Shadow Moss Dr
- 575 Shadow Moss Dr
- 595 Shadow Moss Dr
- 621 Shadow Moss Dr
- 563 Shadow Moss Dr
- 586 Shadow Moss Dr
- 594 Shadow Moss Dr
- 551 Shadow Moss Dr
- 562 Shadow Moss Dr
- 614 Shadow Moss Dr
- 620 Shadow Moss Dr
- 550 Shadow Moss Dr
- 608 Shadow Moss Ln
- 0 Moss Hill Dr Unit 7414217
- 0 Moss Hill Unit 7342787
- 0 Moss Hill Dr
- 535 Shadow Moss Dr
- 624 Shadow Moss Dr
- 536 Shadow Moss Dr
- 600 Shadow Moss Ln