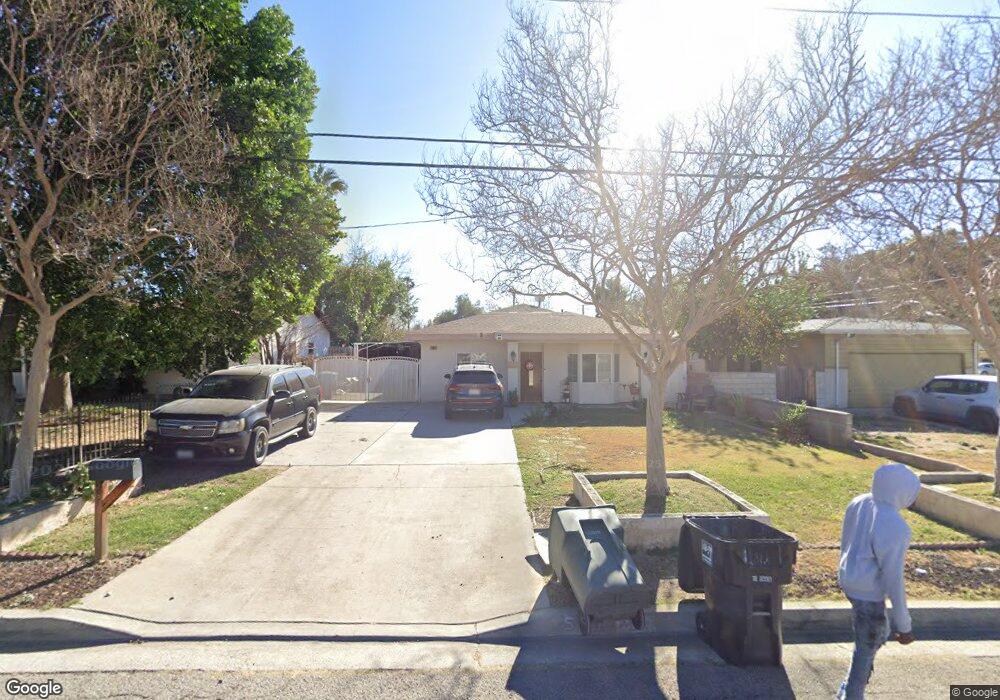
587 W 36th St San Bernardino, CA 92405
Shandin Hills NeighborhoodEstimated Value: $508,343 - $657,000
4
Beds
2
Baths
1,726
Sq Ft
$326/Sq Ft
Est. Value
About This Home
This home is located at 587 W 36th St, San Bernardino, CA 92405 and is currently estimated at $563,336, approximately $326 per square foot. 587 W 36th St is a home located in San Bernardino County with nearby schools including Marshall Elementary School, Golden Valley Middle School, and San Bernardino High School.
Ownership History
Date
Name
Owned For
Owner Type
Purchase Details
Closed on
Oct 13, 2016
Sold by
Gonzalez Victor
Bought by
Gonzalez Luis
Current Estimated Value
Purchase Details
Closed on
Dec 22, 2011
Sold by
Gonzalez Leonor
Bought by
Gonzalez Victor
Purchase Details
Closed on
Oct 20, 2011
Sold by
Gonzalez Luis A and Gonzalez Nestor M
Bought by
Gonzalez Victor
Home Financials for this Owner
Home Financials are based on the most recent Mortgage that was taken out on this home.
Original Mortgage
$114,000
Interest Rate
3.94%
Mortgage Type
New Conventional
Purchase Details
Closed on
Jul 2, 2007
Sold by
Gonzalez Luis A
Bought by
Gonzalez Luis A and Gonzalez Nestor M
Purchase Details
Closed on
Jan 19, 2006
Sold by
Gonzalez Daisy
Bought by
Gonzalez Luis A
Home Financials for this Owner
Home Financials are based on the most recent Mortgage that was taken out on this home.
Original Mortgage
$49,000
Interest Rate
6.21%
Mortgage Type
Stand Alone Second
Purchase Details
Closed on
Jan 4, 2006
Sold by
Hatton Kevin Ross
Bought by
Gonzalez Luis A
Home Financials for this Owner
Home Financials are based on the most recent Mortgage that was taken out on this home.
Original Mortgage
$49,000
Interest Rate
6.21%
Mortgage Type
Stand Alone Second
Create a Home Valuation Report for This Property
The Home Valuation Report is an in-depth analysis detailing your home's value as well as a comparison with similar homes in the area
Home Values in the Area
Average Home Value in this Area
Purchase History
| Date | Buyer | Sale Price | Title Company |
|---|---|---|---|
| Gonzalez Luis | -- | None Available | |
| Gonzalez Victor | -- | Netco Title | |
| Gonzalez Victor | $120,000 | Netco Title | |
| Gonzalez Luis A | -- | None Available | |
| Gonzalez Luis A | -- | Chicago Title Company | |
| Gonzalez Luis A | $245,000 | Chicago Title Company |
Source: Public Records
Mortgage History
| Date | Status | Borrower | Loan Amount |
|---|---|---|---|
| Previous Owner | Gonzalez Victor | $114,000 | |
| Previous Owner | Gonzalez Luis A | $49,000 | |
| Previous Owner | Gonzalez Luis A | $196,000 |
Source: Public Records
Tax History Compared to Growth
Tax History
| Year | Tax Paid | Tax Assessment Tax Assessment Total Assessment is a certain percentage of the fair market value that is determined by local assessors to be the total taxable value of land and additions on the property. | Land | Improvement |
|---|---|---|---|---|
| 2025 | $3,641 | $284,343 | $87,044 | $197,299 |
| 2024 | $3,641 | $278,767 | $85,337 | $193,430 |
| 2023 | $3,550 | $273,301 | $83,664 | $189,637 |
| 2022 | $3,556 | $267,943 | $82,024 | $185,919 |
| 2021 | $3,562 | $262,690 | $80,416 | $182,274 |
| 2020 | $3,571 | $259,996 | $79,591 | $180,405 |
| 2019 | $3,466 | $254,898 | $78,030 | $176,868 |
| 2018 | $3,426 | $249,900 | $76,500 | $173,400 |
| 2017 | $3,321 | $245,000 | $75,000 | $170,000 |
| 2016 | $1,780 | $127,326 | $38,198 | $89,128 |
| 2015 | $1,662 | $125,413 | $37,624 | $87,789 |
| 2014 | $1,616 | $122,956 | $36,887 | $86,069 |
Source: Public Records
Map
Nearby Homes
- 3489 N E St
- 3505 N G St
- 3347 Acacia Ave
- 0 El Camino Rd
- 449 Skylark Dr
- 3720 Ridge Line Dr
- 3307 N E St
- 3432 N Arrowhead Ave
- 875 W Vista Dr
- 3245 N E St
- 0 Cottage Dr Unit SW24192848
- 3570 Ridge Line Dr
- 395 W 39th St
- 782 W Marshall Blvd
- 3271 N I St
- 3404 Beverly Dr
- 3599 Genevieve St
- 279 W 39th St
- 3040 N F St
- 3066 N D St