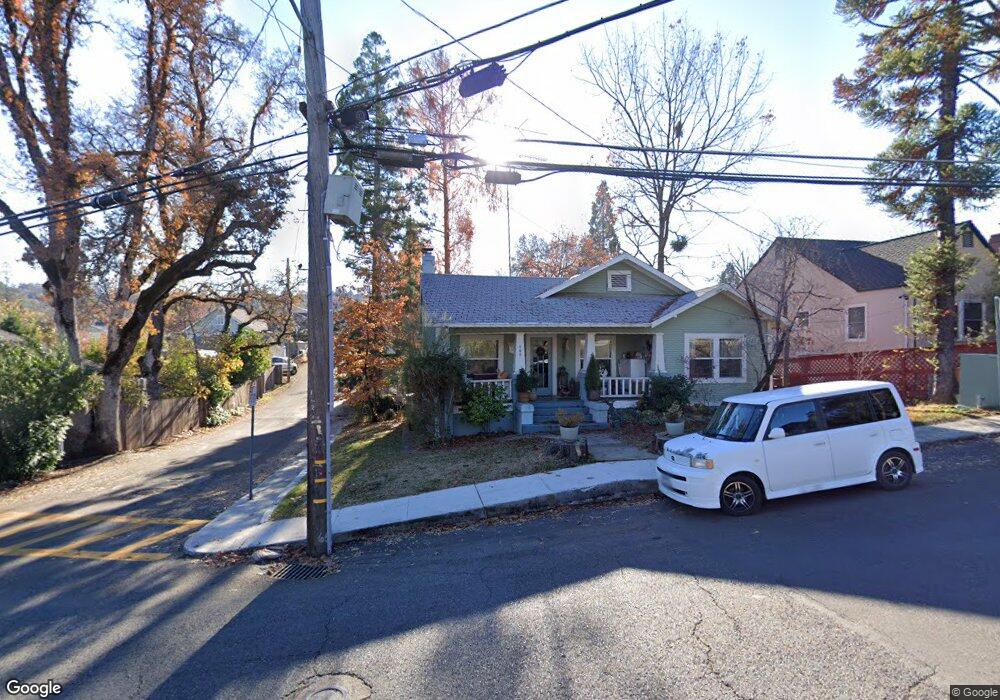
588 Canal St Placerville, CA 95667
Estimated Value: $367,000 - $454,000
3
Beds
1
Bath
1,589
Sq Ft
$256/Sq Ft
Est. Value
About This Home
This home is located at 588 Canal St, Placerville, CA 95667 and is currently estimated at $407,559, approximately $256 per square foot. 588 Canal St is a home located in El Dorado County with nearby schools including El Dorado High School, Country Day Montessori, and El Dorado Adventist School.
Ownership History
Date
Name
Owned For
Owner Type
Purchase Details
Closed on
Apr 30, 2004
Sold by
Nordquist John M and Campbell Nordquist Dawn R
Bought by
Nordquist John M and Campbell Nordquist Dawn R
Current Estimated Value
Purchase Details
Closed on
Dec 8, 1997
Sold by
Dixon Miriam Maguire
Bought by
Norquist John M and Campbell Nordquist Dawn R
Home Financials for this Owner
Home Financials are based on the most recent Mortgage that was taken out on this home.
Original Mortgage
$134,607
Outstanding Balance
$22,692
Interest Rate
7.19%
Mortgage Type
FHA
Estimated Equity
$384,867
Create a Home Valuation Report for This Property
The Home Valuation Report is an in-depth analysis detailing your home's value as well as a comparison with similar homes in the area
Home Values in the Area
Average Home Value in this Area
Purchase History
We collect this data history from publicly available records. To have your information removed, we recommend requesting removal directly through your county’s website.
| Date | Buyer | Sale Price | Title Company |
|---|---|---|---|
| Nordquist John M | -- | Inter County Title Co | |
| Norquist John M | $136,000 | Chicago Title Co |
Source: Public Records
Mortgage History
We collect this data history from publicly available records. To have your information removed, we recommend requesting removal directly through your county’s website.
| Date | Status | Borrower | Loan Amount |
|---|---|---|---|
| Open | Norquist John M | $134,607 |
Source: Public Records
Tax History
| Year | Tax Paid | Tax Assessment Tax Assessment Total Assessment is a certain percentage of the fair market value that is determined by local assessors to be the total taxable value of land and additions on the property. | Land | Improvement |
|---|---|---|---|---|
| 2025 | $2,198 | $217,121 | $58,581 | $158,540 |
| 2024 | $2,198 | $212,865 | $57,433 | $155,432 |
| 2023 | $2,171 | $208,692 | $56,307 | $152,385 |
| 2022 | $2,139 | $204,601 | $55,203 | $149,398 |
| 2021 | $2,114 | $200,590 | $54,121 | $146,469 |
| 2020 | $2,082 | $198,535 | $53,567 | $144,968 |
| 2019 | $2,055 | $194,643 | $52,517 | $142,126 |
| 2018 | $1,992 | $190,828 | $51,488 | $139,340 |
| 2017 | $1,962 | $187,087 | $50,479 | $136,608 |
| 2016 | $1,931 | $183,420 | $49,490 | $133,930 |
| 2015 | $1,841 | $180,667 | $48,748 | $131,919 |
| 2014 | $1,841 | $177,130 | $47,794 | $129,336 |
Source: Public Records
Map
Nearby Homes
- 2796 Coloma St
- 837 Vivian Ct
- 2905 Wood St
- 2968 Coloma St
- 2940 Conrad St
- 2757 Spear St
- 837 Hillcrest St
- 525 Skyline Dr
- 894 Hillcrest St
- 629 James Dr
- 910 Reservoir St
- 901 Union St
- 691 David Cir
- 0 Big Cut Rd Unit 225072888
- 930 Oak Terrace Rd
- 3075 Gold Nugget Way
- 810 Phillip Ct
- 8325 County Rd M44
- 841 Oak Crest Cir
- 3157 Benham Ct
Your Personal Tour Guide
Ask me questions while you tour the home.