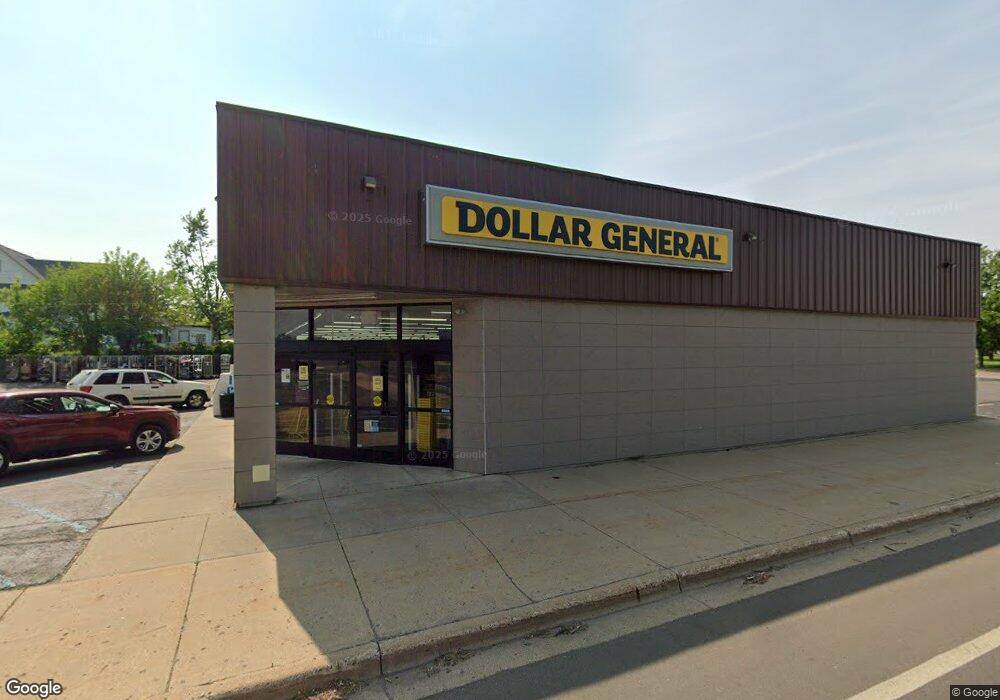
588 Capital Ave SW Battle Creek, MI 49015
Central Battle Creek NeighborhoodEstimated Value: $1,630,431
--
Bed
--
Bath
3,650
Sq Ft
$447/Sq Ft
Est. Value
About This Home
This home is located at 588 Capital Ave SW, Battle Creek, MI 49015 and is currently estimated at $1,630,431, approximately $446 per square foot. 588 Capital Ave SW is a home located in Calhoun County with nearby schools including Ann J. Kellogg School, Springfield Middle School, and Battle Creek Central High School.
Ownership History
Date
Name
Owned For
Owner Type
Purchase Details
Closed on
Jun 4, 2021
Sold by
Dg Battle Creek Llc
Bought by
Capital Plaza Llc
Current Estimated Value
Home Financials for this Owner
Home Financials are based on the most recent Mortgage that was taken out on this home.
Original Mortgage
$885,500
Outstanding Balance
$801,710
Interest Rate
2.9%
Mortgage Type
Commercial
Estimated Equity
$828,721
Purchase Details
Closed on
Sep 28, 2016
Sold by
Wc Battle Creek Llc
Bought by
Dg Battle Creek Llc
Home Financials for this Owner
Home Financials are based on the most recent Mortgage that was taken out on this home.
Original Mortgage
$679,200
Interest Rate
3.43%
Mortgage Type
Future Advance Clause Open End Mortgage
Purchase Details
Closed on
Aug 31, 2011
Sold by
Lyon Daniel and Lyon Charla R
Bought by
Wc Battle Creek Llc
Purchase Details
Closed on
Jun 6, 2005
Sold by
Lyon Cheryl and Cadden Cheryl Lyon
Bought by
Lyon Daniel
Purchase Details
Closed on
Dec 17, 2004
Sold by
Royal Beverly M and Beverly M Royal Living Trust
Bought by
Lyon Daniel and Lyon Cheryl
Purchase Details
Closed on
Feb 24, 1997
Bought by
Royal
Purchase Details
Closed on
Nov 18, 1996
Bought by
Royal Trustee
Create a Home Valuation Report for This Property
The Home Valuation Report is an in-depth analysis detailing your home's value as well as a comparison with similar homes in the area
Home Values in the Area
Average Home Value in this Area
Purchase History
| Date | Buyer | Sale Price | Title Company |
|---|---|---|---|
| Capital Plaza Llc | -- | Chicago Title | |
| Dg Battle Creek Llc | $849,000 | Fidelity National Title | |
| Wc Battle Creek Llc | $155,000 | None Available | |
| Lyon Daniel | -- | -- | |
| Lyon Daniel | $250,000 | -- | |
| Royal | -- | -- | |
| Royal Trustee | -- | -- |
Source: Public Records
Mortgage History
| Date | Status | Borrower | Loan Amount |
|---|---|---|---|
| Open | Capital Plaza Llc | $885,500 | |
| Previous Owner | Dg Battle Creek Llc | $679,200 |
Source: Public Records
Tax History Compared to Growth
Tax History
| Year | Tax Paid | Tax Assessment Tax Assessment Total Assessment is a certain percentage of the fair market value that is determined by local assessors to be the total taxable value of land and additions on the property. | Land | Improvement |
|---|---|---|---|---|
| 2025 | -- | $142,100 | $0 | $0 |
| 2024 | $6,112 | $130,151 | $0 | $0 |
| 2023 | $7,777 | $126,454 | $0 | $0 |
| 2022 | $5,524 | $117,607 | $0 | $0 |
| 2021 | $8,135 | $129,388 | $0 | $0 |
| 2020 | $763 | $134,823 | $0 | $0 |
| 2019 | $7,757 | $119,062 | $0 | $0 |
| 2018 | $7,757 | $126,194 | $57,272 | $68,922 |
| 2017 | $6,291 | $115,163 | $0 | $0 |
| 2016 | $5,852 | $100,313 | $0 | $0 |
| 2015 | $5,735 | $100,819 | $22,064 | $78,755 |
| 2014 | $5,735 | $89,241 | $22,064 | $67,177 |
Source: Public Records
Map
Nearby Homes
- 127 W Territorial Rd
- 41 Randolph St
- 32 Territorial Rd E
- 296 Meachem Ave
- 137 Fairfield Ave
- 35 Eldred St
- 235 Fairfield Ave
- 100 Eldred St
- 1 Grand Blvd
- 71 Burnham St W
- 57 Boulder St
- 15 Marine Dr
- 247 Iroquois Ave
- 236 Burnham St W
- 184 Territorial Rd W
- 171 Goguac St W
- 212 Goguac St W
- 17 Tennyson Ave
- 210 Battle Creek Ave
- 77 Leitch Dr
- 588 Capital Ave SW Unit A
- 15 Bidwell St W
- 16 Summer St
- 19 Bidwell St W
- 20 Summer St
- 25 B__2f Bidwell St
- 22 Summer St
- 25 Bidwell St W
- 587 Capital Ave SW
- 589 Capital Ave SW
- 593 Capital Ave SW
- 29 Bidwell St W
- 597 Capital Ave SW
- 601 Capital Ave SW
- 610 Capital Ave SW
- 9 Summer St
- 26 Summer St
- 31 Bidwell St W
- 32 Summer St
- 21 Summer St