Estimated Value: $138,000 - $166,000
3
Beds
1
Bath
816
Sq Ft
$189/Sq Ft
Est. Value
About This Home
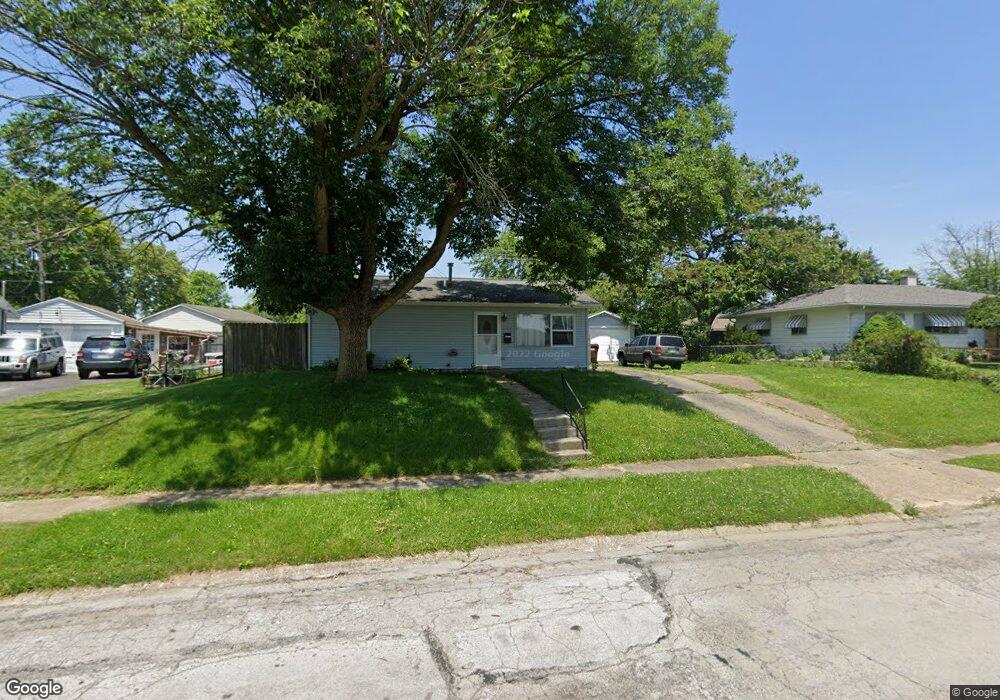
This home is located at 588 Layne Dr, Xenia, OH 45385 and is currently estimated at $154,333, approximately $189 per square foot. 588 Layne Dr is a home located in Greene County with nearby schools including Xenia High School, Summit Academy Community School for Alternative Learners - Xenia, and Legacy Christian Academy.
Ownership History
Date
Name
Owned For
Owner Type
Purchase Details
Closed on
Feb 5, 2016
Sold by
Moffitt Christian D and Moffitt Kelsey M
Bought by
Moffitt Christian D and Moffitt Kelsey M
Current Estimated Value
Purchase Details
Closed on
Apr 25, 2005
Sold by
Hud
Bought by
Moffitt Christian D
Home Financials for this Owner
Home Financials are based on the most recent Mortgage that was taken out on this home.
Original Mortgage
$48,100
Outstanding Balance
$25,109
Interest Rate
6.06%
Mortgage Type
Unknown
Estimated Equity
$129,224
Purchase Details
Closed on
Dec 13, 2004
Sold by
Evans Donald D
Bought by
Hud
Purchase Details
Closed on
Jul 10, 1998
Sold by
Brown Ralph and Lee Oma
Bought by
Evans Donald D
Home Financials for this Owner
Home Financials are based on the most recent Mortgage that was taken out on this home.
Original Mortgage
$55,828
Interest Rate
7.15%
Mortgage Type
FHA
Create a Home Valuation Report for This Property
The Home Valuation Report is an in-depth analysis detailing your home's value as well as a comparison with similar homes in the area
Home Values in the Area
Average Home Value in this Area
Purchase History
| Date | Buyer | Sale Price | Title Company |
|---|---|---|---|
| Moffitt Christian D | -- | First American Title | |
| Moffitt Christian D | $48,500 | -- | |
| Hud | $54,000 | -- | |
| Evans Donald D | $55,900 | -- |
Source: Public Records
Mortgage History
| Date | Status | Borrower | Loan Amount |
|---|---|---|---|
| Open | Moffitt Christian D | $48,100 | |
| Previous Owner | Evans Donald D | $55,828 |
Source: Public Records
Tax History Compared to Growth
Tax History
| Year | Tax Paid | Tax Assessment Tax Assessment Total Assessment is a certain percentage of the fair market value that is determined by local assessors to be the total taxable value of land and additions on the property. | Land | Improvement |
|---|---|---|---|---|
| 2024 | $1,490 | $34,810 | $9,330 | $25,480 |
| 2023 | $1,490 | $34,810 | $9,330 | $25,480 |
| 2022 | $1,237 | $24,660 | $6,660 | $18,000 |
| 2021 | $1,254 | $24,660 | $6,660 | $18,000 |
| 2020 | $1,201 | $24,660 | $6,660 | $18,000 |
| 2019 | $1,152 | $22,260 | $4,630 | $17,630 |
| 2018 | $1,156 | $22,260 | $4,630 | $17,630 |
| 2017 | $1,119 | $22,260 | $4,630 | $17,630 |
| 2016 | $1,120 | $21,150 | $4,630 | $16,520 |
| 2015 | $1,123 | $21,150 | $4,630 | $16,520 |
| 2014 | $1,075 | $21,150 | $4,630 | $16,520 |
Source: Public Records
Map
Nearby Homes
- 343 Sheelin Rd
- 912 Omard Dr
- 883 Omard Dr
- 1351 Omard Dr
- 509 Antrim Rd
- 1223 June Dr
- 1233 June Dr
- 1283 June Dr
- 1391 June Dr
- 613 N West St
- 1342 Kylemore Dr
- 516 N King St
- 137 Pleasant St
- 659 N King St
- 878 N Detroit St
- 902 N Detroit St
- 523 Hollywood Blvd
- Harmony Plan at Grandstone Trace
- Newcastle Plan at Grandstone Trace
- Pendleton Plan at Grandstone Trace