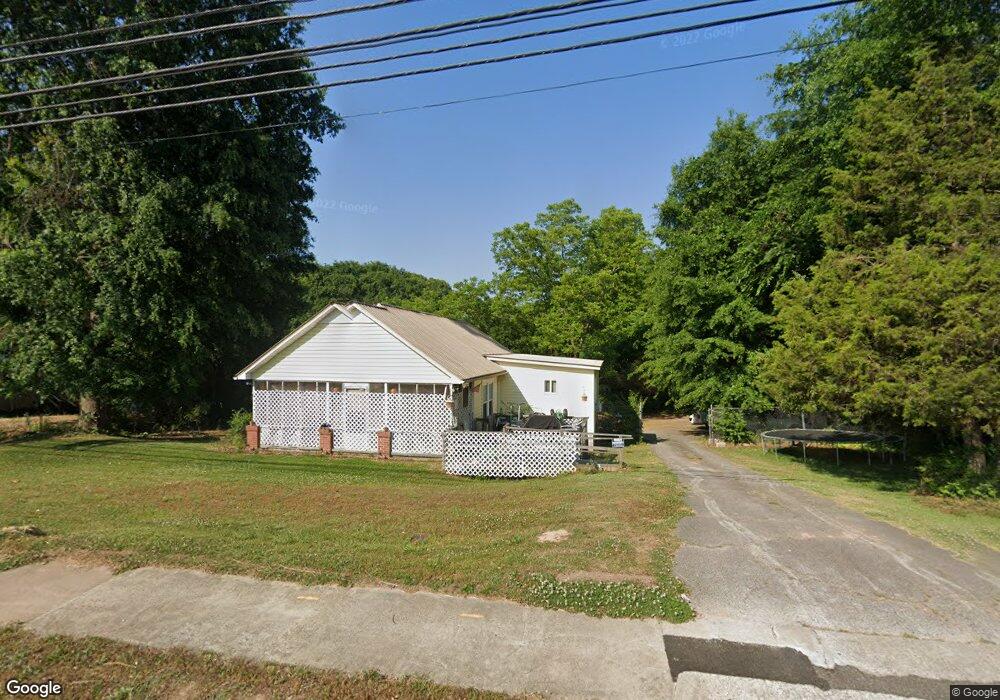
588 Mize Rd Toccoa, GA 30577
Estimated Value: $130,120 - $186,000
3
Beds
1
Bath
1,172
Sq Ft
$138/Sq Ft
Est. Value
About This Home
This home is located at 588 Mize Rd, Toccoa, GA 30577 and is currently estimated at $161,530, approximately $137 per square foot. 588 Mize Rd is a home located in Stephens County with nearby schools including Stephens County High School.
Ownership History
Date
Name
Owned For
Owner Type
Purchase Details
Closed on
Jul 27, 2009
Sold by
Martin Jessie
Bought by
Gillerson Zemmia
Current Estimated Value
Home Financials for this Owner
Home Financials are based on the most recent Mortgage that was taken out on this home.
Original Mortgage
$72,754
Outstanding Balance
$47,215
Interest Rate
5.36%
Mortgage Type
New Conventional
Estimated Equity
$114,315
Purchase Details
Closed on
Nov 9, 2007
Sold by
Not Provided
Bought by
Gillerson Zemmia and Gillerson Gerald
Purchase Details
Closed on
Jul 30, 1999
Bought by
<Buyer Info Not Present>
Create a Home Valuation Report for This Property
The Home Valuation Report is an in-depth analysis detailing your home's value as well as a comparison with similar homes in the area
Purchase History
| Date | Buyer | Sale Price | Title Company |
|---|---|---|---|
| Gillerson Zemmia | $69,000 | -- | |
| Gillerson Zemmia | $69,000 | -- | |
| Gillerson Zemmia | -- | -- | |
| <Buyer Info Not Present> | $25,000 | -- |
Source: Public Records
Mortgage History
| Date | Status | Borrower | Loan Amount |
|---|---|---|---|
| Open | Gillerson Zemmia | $72,754 | |
| Closed | Gillerson Zemmia | $72,754 |
Source: Public Records
Tax History
| Year | Tax Paid | Tax Assessment Tax Assessment Total Assessment is a certain percentage of the fair market value that is determined by local assessors to be the total taxable value of land and additions on the property. | Land | Improvement |
|---|---|---|---|---|
| 2025 | $703 | $32,919 | $1,411 | $31,508 |
| 2024 | $624 | $22,506 | $1,411 | $21,095 |
| 2023 | $566 | $21,019 | $1,411 | $19,608 |
| 2022 | $537 | $20,040 | $1,411 | $18,629 |
| 2021 | $525 | $18,792 | $1,411 | $17,381 |
| 2020 | $526 | $18,656 | $1,411 | $17,245 |
| 2019 | $534 | $18,831 | $1,411 | $17,420 |
| 2018 | $534 | $18,831 | $1,411 | $17,420 |
| 2017 | $545 | $18,913 | $1,411 | $17,502 |
| 2016 | $536 | $18,913 | $1,411 | $17,502 |
| 2015 | $549 | $18,520 | $1,411 | $17,108 |
| 2014 | $558 | $18,520 | $1,411 | $17,109 |
| 2013 | -- | $15,530 | $1,411 | $14,118 |
Source: Public Records
Map
Nearby Homes
- 151 Richardson St
- 1037 S Pond St
- 1203 Mize Rd
- 943 S Pond St
- 103 Old Liberty Hill Rd
- 526 Poplar St
- 0 Valley Dr Unit 7675761
- 0 Valley Dr Unit 10600268
- 372 Hilltop Way
- 820 Collier Rd
- 574 S Sage St
- 926 Skyline Dr
- 475 Hilltop Way
- 253 Stancil Dr
- 168 Yearwood St
- 500 S Pond St
- 478 S Pond St
- 229 Hilltop Ln
- 98 Wood St
- 9 Poplar St
Your Personal Tour Guide
Ask me questions while you tour the home.