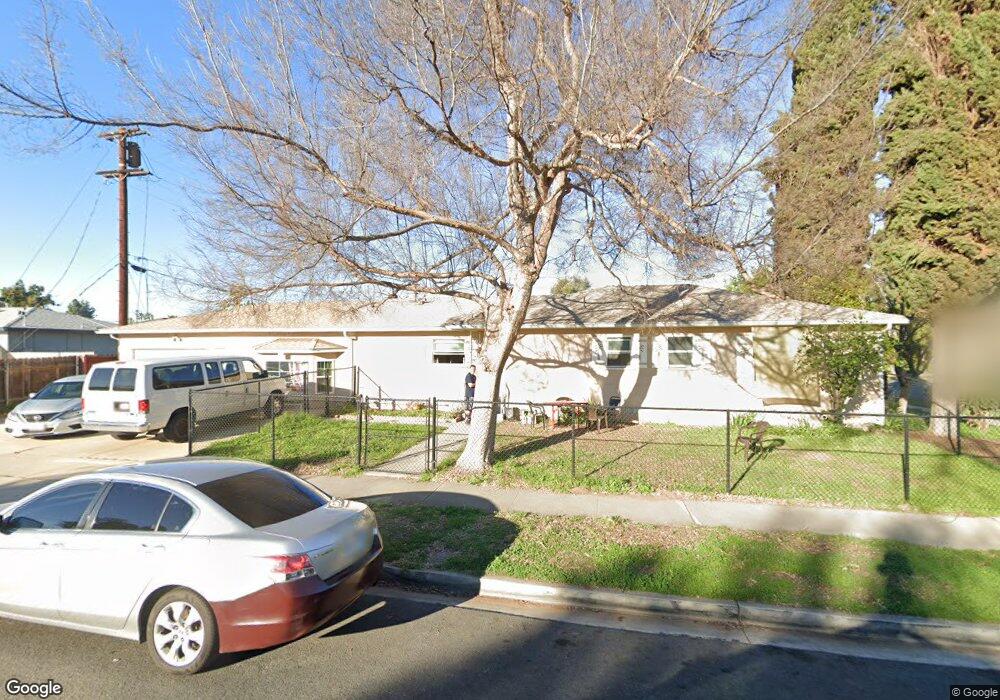
588 Roberta Ave El Cajon, CA 92021
Estimated Value: $779,000 - $867,000
4
Beds
2
Baths
1,792
Sq Ft
$457/Sq Ft
Est. Value
About This Home
This home is located at 588 Roberta Ave, El Cajon, CA 92021 and is currently estimated at $819,457, approximately $457 per square foot. 588 Roberta Ave is a home located in San Diego County with nearby schools including Naranca Elementary School, Cajon Valley Middle School, and El Cajon Valley High School.
Ownership History
Date
Name
Owned For
Owner Type
Purchase Details
Closed on
Jan 21, 2009
Sold by
Moses Michael Gary
Bought by
Developmental Services Continuum Inc
Current Estimated Value
Home Financials for this Owner
Home Financials are based on the most recent Mortgage that was taken out on this home.
Original Mortgage
$288,000
Interest Rate
5.19%
Mortgage Type
Purchase Money Mortgage
Purchase Details
Closed on
Jul 2, 1996
Sold by
Moses Orville J and Moses Eileen M
Bought by
Moses Orville J and Moses Eileen M
Create a Home Valuation Report for This Property
The Home Valuation Report is an in-depth analysis detailing your home's value as well as a comparison with similar homes in the area
Purchase History
| Date | Buyer | Sale Price | Title Company |
|---|---|---|---|
| Developmental Services Continuum Inc | $320,000 | Fidelity National Title | |
| Moses Orville J | -- | -- |
Source: Public Records
Mortgage History
| Date | Status | Borrower | Loan Amount |
|---|---|---|---|
| Previous Owner | Developmental Services Continuum Inc | $288,000 |
Source: Public Records
Tax History
| Year | Tax Paid | Tax Assessment Tax Assessment Total Assessment is a certain percentage of the fair market value that is determined by local assessors to be the total taxable value of land and additions on the property. | Land | Improvement |
|---|---|---|---|---|
| 2025 | $1,440 | $412,065 | $154,522 | $257,543 |
| 2024 | $1,440 | $403,987 | $151,493 | $252,494 |
| 2023 | $1,887 | $396,067 | $148,523 | $247,544 |
| 2022 | $1,678 | $388,302 | $145,611 | $242,691 |
| 2021 | $1,559 | $380,689 | $142,756 | $237,933 |
| 2020 | $1,239 | $376,787 | $141,293 | $235,494 |
| 2019 | $42 | $369,400 | $138,523 | $230,877 |
| 2018 | $42 | $362,157 | $135,807 | $226,350 |
| 2017 | $41 | $355,057 | $133,145 | $221,912 |
| 2016 | $39 | $348,096 | $130,535 | $217,561 |
| 2015 | $39 | $342,869 | $128,575 | $214,294 |
| 2014 | $40 | $336,154 | $126,057 | $210,097 |
Source: Public Records
Map
Nearby Homes
- 503 N 1st St Unit 42B
- 1229 E Madison Ave
- 1055 Naranca Ave Unit 7
- 540 Oakdale Ln Unit C
- 540 Oakdale Ln Unit A
- 1244 E Madison Ave Unit C
- 1250 E Madison Ave Unit C
- 359 N 1st St
- 390 N 1st St Unit 23
- 522 Mary Ln
- 565 June Way
- 389 Shady Ln Unit D
- 1174 E Main St Unit 62
- 1174 E Main St Unit 74
- 1174 E Main St
- 1174 E Main St Unit 103
- 1174 E Main St Unit 113
- 244 Shady Ln Unit 44
- 917 N 1st St
- 166 N 1st St Unit 23
Your Personal Tour Guide
Ask me questions while you tour the home.