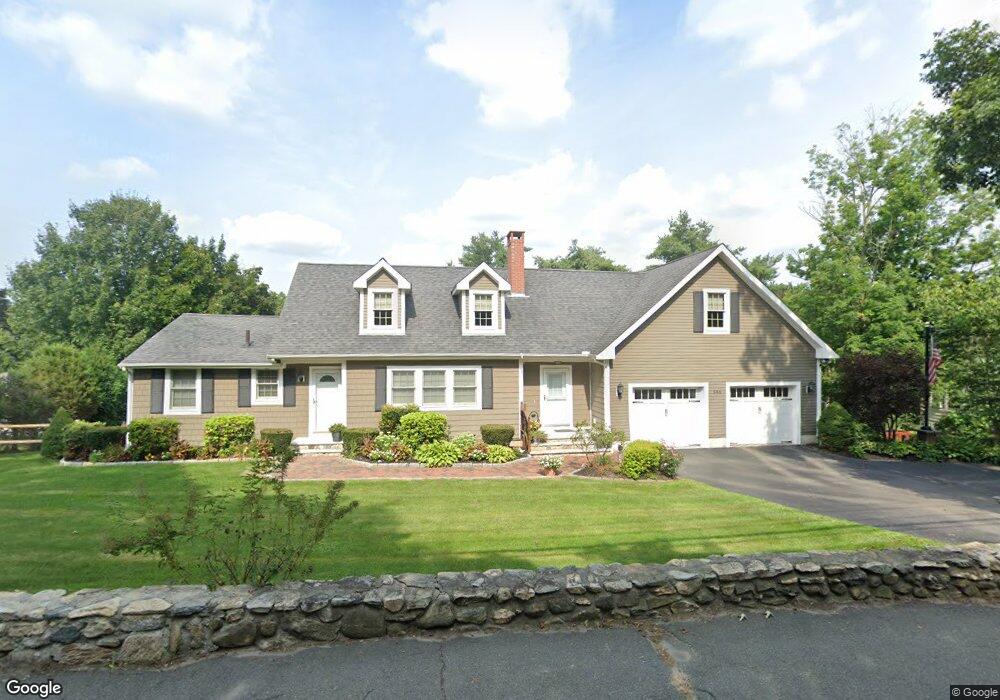
588 Winter St Framingham, MA 01702
Estimated Value: $713,000 - $826,000
3
Beds
2
Baths
2,182
Sq Ft
$358/Sq Ft
Est. Value
About This Home
This home is located at 588 Winter St, Framingham, MA 01702 and is currently estimated at $781,928, approximately $358 per square foot. 588 Winter St is a home located in Middlesex County with nearby schools including Framingham High School, Pincushion Hill Montessori School, and Saint Bridget School.
Ownership History
Date
Name
Owned For
Owner Type
Purchase Details
Closed on
May 17, 1996
Sold by
Martin Thomas G and Martin Beverly R
Bought by
Gillis Catherine
Current Estimated Value
Home Financials for this Owner
Home Financials are based on the most recent Mortgage that was taken out on this home.
Original Mortgage
$108,000
Interest Rate
7.77%
Mortgage Type
Purchase Money Mortgage
Create a Home Valuation Report for This Property
The Home Valuation Report is an in-depth analysis detailing your home's value as well as a comparison with similar homes in the area
Home Values in the Area
Average Home Value in this Area
Purchase History
| Date | Buyer | Sale Price | Title Company |
|---|---|---|---|
| Gillis Catherine | $135,000 | -- | |
| Gillis Catherine V | $135,000 | -- |
Source: Public Records
Mortgage History
| Date | Status | Borrower | Loan Amount |
|---|---|---|---|
| Open | Gillis Catherine V | $25,000 | |
| Open | Gillis Catherine V | $108,000 | |
| Closed | Gillis Catherine V | $108,000 |
Source: Public Records
Tax History
| Year | Tax Paid | Tax Assessment Tax Assessment Total Assessment is a certain percentage of the fair market value that is determined by local assessors to be the total taxable value of land and additions on the property. | Land | Improvement |
|---|---|---|---|---|
| 2025 | $9,712 | $813,400 | $272,500 | $540,900 |
| 2024 | $8,930 | $716,700 | $242,900 | $473,800 |
| 2023 | $8,433 | $644,200 | $213,600 | $430,600 |
| 2022 | $8,116 | $590,700 | $193,900 | $396,800 |
| 2021 | $7,810 | $555,900 | $186,400 | $369,500 |
| 2020 | $7,838 | $523,200 | $163,800 | $359,400 |
| 2019 | $7,513 | $488,500 | $159,200 | $329,300 |
| 2018 | $7,334 | $449,400 | $151,200 | $298,200 |
| 2017 | $7,214 | $431,700 | $146,600 | $285,100 |
| 2016 | $6,882 | $396,000 | $146,600 | $249,400 |
| 2015 | $6,884 | $386,300 | $146,700 | $239,600 |
Source: Public Records
Map
Nearby Homes
- 12 & 14 Waverly St
- 327 Singletary Ln
- 81 Edgewater Dr
- 34 Jodie Rd
- 10 Rhubena St
- 15 Bellmore Rd
- 45 Daytona Ave
- 33 Stevens Rd
- 768 Waverley St
- 1116 Waverley
- 11 Harmony Ln
- 139 Salem End Rd
- 120 Franklin St
- 575 Union Ave Unit 1
- 22 Gryzboska Cir
- 1186 Worcester Rd Unit 610
- 37 Riverview Dr
- 50 Kittredge Rd
- 1321 Worcester Rd Unit 603
- 1321 Worcester Rd Unit 201
Your Personal Tour Guide
Ask me questions while you tour the home.