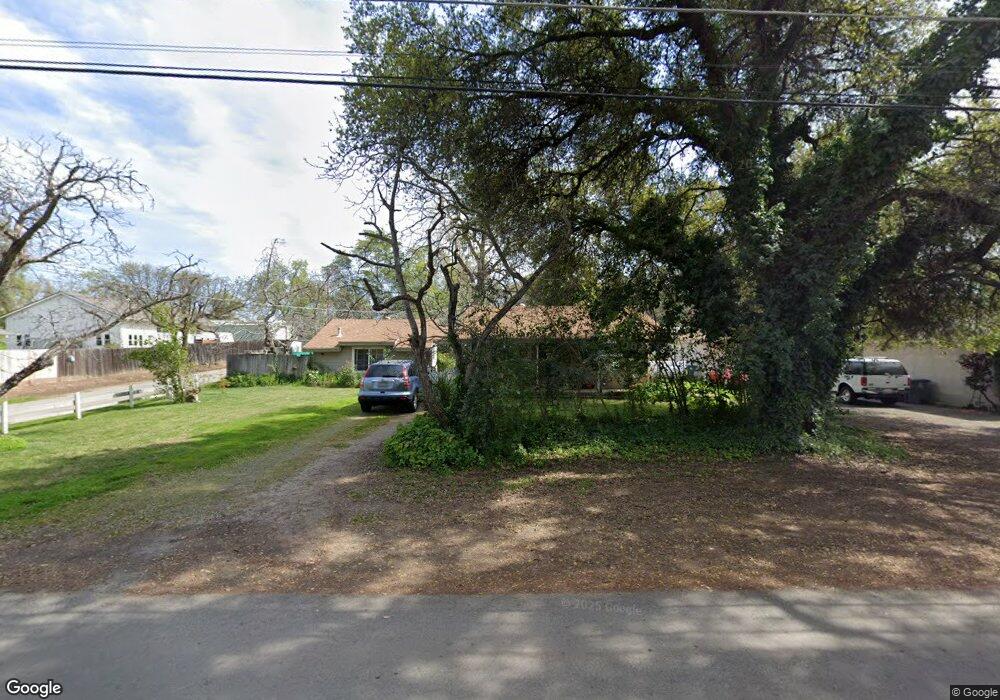
5880 Saunders Ave Loomis, CA 95650
Estimated Value: $356,329 - $842,000
1
Bed
1
Bath
579
Sq Ft
$952/Sq Ft
Est. Value
About This Home
This home is located at 5880 Saunders Ave, Loomis, CA 95650 and is currently estimated at $551,082, approximately $951 per square foot. 5880 Saunders Ave is a home located in Placer County with nearby schools including Del Oro High School, Loomis Basin Charter School, and Holy Cross Lutheran Academy.
Ownership History
Date
Name
Owned For
Owner Type
Purchase Details
Closed on
Jun 23, 2025
Sold by
Noguchi Hideo
Bought by
Ketcherside-Noguchi Sharon E
Current Estimated Value
Purchase Details
Closed on
Jan 29, 2025
Sold by
Noguchi Sharon E Ketcherside
Bought by
Sharon Ketcherside-Noguchi Living Trust and Ketcherside-Noguchi
Purchase Details
Closed on
Jan 27, 2025
Sold by
Ketcherside Homer G
Bought by
Homer G Ketcherside Living Trust and Ketcherside
Purchase Details
Closed on
Dec 8, 2023
Sold by
Ketcherside Irrevocable Trust and Ketcherside Homer G
Bought by
Ketcherside Homer G and Noguchi Sharon E
Purchase Details
Closed on
Aug 30, 2017
Sold by
Ketcherside Dolly E
Bought by
Ketcherside Homer G
Purchase Details
Closed on
Aug 29, 2017
Sold by
Ketcherside Dolly E
Bought by
Ketcherside Homer G
Purchase Details
Closed on
Aug 22, 2017
Sold by
Ketcherside Dolly E
Bought by
Ketcherside Dolly E
Purchase Details
Closed on
Nov 10, 2000
Sold by
Ketcherside Dolly E
Bought by
Ketcherside Dolly E
Create a Home Valuation Report for This Property
The Home Valuation Report is an in-depth analysis detailing your home's value as well as a comparison with similar homes in the area
Home Values in the Area
Average Home Value in this Area
Purchase History
| Date | Buyer | Sale Price | Title Company |
|---|---|---|---|
| Ketcherside-Noguchi Sharon E | -- | None Listed On Document | |
| Sharon Ketcherside-Noguchi Living Trust | -- | None Listed On Document | |
| Homer G Ketcherside Living Trust | -- | None Listed On Document | |
| Ketcherside Homer G | -- | None Listed On Document | |
| Ketcherside Homer G | -- | None Available | |
| Ketcherside Homer G | -- | None Available | |
| Ketcherside Dolly E | -- | None Available | |
| Ketcherside Dolly E | -- | -- |
Source: Public Records
Tax History
| Year | Tax Paid | Tax Assessment Tax Assessment Total Assessment is a certain percentage of the fair market value that is determined by local assessors to be the total taxable value of land and additions on the property. | Land | Improvement |
|---|---|---|---|---|
| 2025 | $771 | $167,506 | $47,999 | $119,507 |
| 2023 | $771 | $30,944 | $7,993 | $22,951 |
| 2022 | $735 | $30,338 | $7,837 | $22,501 |
| 2021 | $710 | $29,744 | $7,684 | $22,060 |
| 2020 | $697 | $29,440 | $7,606 | $21,834 |
| 2019 | $682 | $28,863 | $7,457 | $21,406 |
| 2018 | $762 | $28,298 | $7,311 | $20,987 |
| 2017 | $637 | $27,744 | $7,168 | $20,576 |
| 2016 | $619 | $27,201 | $7,028 | $20,173 |
| 2015 | $603 | $26,793 | $6,923 | $19,870 |
| 2014 | $591 | $26,269 | $6,788 | $19,481 |
Source: Public Records
Map
Nearby Homes
- 0 Webb St
- 5782 King Rd
- 3437 Taylor Rd
- 6300 Arcadia Ave
- 5750 Connie Ct
- 6100 Helens Ct
- 5567 Myrtle Dr
- 6139 Smoke Wood Ct
- 3586 Sun Knoll Dr
- 3390 Taylor Rd Unit 12
- 3420 Grove Cir
- 6154 S Walnut St Unit 40
- 3838 Circle Dr
- 6244 S Walnut St
- 3361 Clayton Ln
- 3955 Stonegate Ct
- 3301 Stone Field Way
- 3899 Martin Ln
- 5854 Brace Rd
- 5833 Mareta Ln
- 5866 Saunders Ave
- 5910 Saunders Ave
- 5930 Saunders Ave
- 6008 Katie Ln
- 5995 Katie Ln
- 5834 Saunders Ave
- 5865 Saunders Ave
- 5929 Saunders Ave
- 5845 Saunders Ave
- 5964 Saunders Ave
- 5907 Saunders Ave
- 5968 Saunders Ave
- 5979 Katie Ln
- 6005 Katie Ln
- 5875 Saunders Ave
- 5885 McAllen Dr
- 5917 Saunders Ave
- 5970 Saunders Ave
- 5959 Saunders Ave
- 5795 Saunders Ave
Your Personal Tour Guide
Ask me questions while you tour the home.