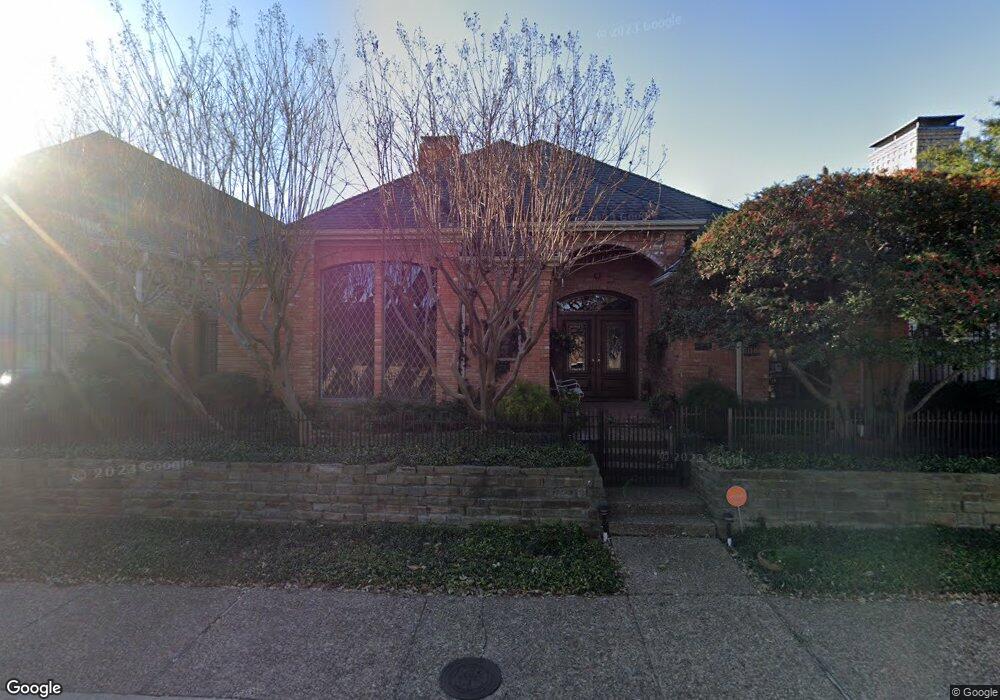
5881 Preston View Blvd Unit 167 Dallas, TX 75240
North Dallas NeighborhoodEstimated Value: $136,601 - $168,000
1
Bed
--
Bath
632
Sq Ft
$235/Sq Ft
Est. Value
About This Home
This home is located at 5881 Preston View Blvd Unit 167, Dallas, TX 75240 and is currently estimated at $148,650, approximately $235 per square foot. 5881 Preston View Blvd Unit 167 is a home located in Dallas County with nearby schools including John J Pershing Elementary School, Benjamin Franklin International Exploratory Academy, and Hillcrest High School.
Ownership History
Date
Name
Owned For
Owner Type
Purchase Details
Closed on
Oct 16, 2025
Sold by
Raney Andrew
Bought by
Raney Andrew and Raney Susan E
Current Estimated Value
Purchase Details
Closed on
Apr 30, 2021
Sold by
Jamoukha Fouad and Jamoukha Daniel Virginie
Bought by
Engelhardt Joseph
Home Financials for this Owner
Home Financials are based on the most recent Mortgage that was taken out on this home.
Original Mortgage
$137,362
Interest Rate
3%
Mortgage Type
New Conventional
Purchase Details
Closed on
Jan 1, 2004
Sold by
Thomas Anita E and Thomas Clarence I
Bought by
Raney Andrew
Purchase Details
Closed on
Dec 17, 2002
Sold by
Baker George August
Bought by
Thomas Clarence I and Thomas Anita E
Home Financials for this Owner
Home Financials are based on the most recent Mortgage that was taken out on this home.
Original Mortgage
$36,000
Interest Rate
6.06%
Create a Home Valuation Report for This Property
The Home Valuation Report is an in-depth analysis detailing your home's value as well as a comparison with similar homes in the area
Home Values in the Area
Average Home Value in this Area
Purchase History
| Date | Buyer | Sale Price | Title Company |
|---|---|---|---|
| Raney Andrew | -- | None Listed On Document | |
| Engelhardt Joseph | -- | None Listed On Document | |
| Raney Andrew | -- | -- | |
| Thomas Clarence I | -- | -- |
Source: Public Records
Mortgage History
| Date | Status | Borrower | Loan Amount |
|---|---|---|---|
| Previous Owner | Engelhardt Joseph | $137,362 | |
| Previous Owner | Thomas Clarence I | $36,000 |
Source: Public Records
Tax History Compared to Growth
Tax History
| Year | Tax Paid | Tax Assessment Tax Assessment Total Assessment is a certain percentage of the fair market value that is determined by local assessors to be the total taxable value of land and additions on the property. | Land | Improvement |
|---|---|---|---|---|
| 2025 | $948 | $142,200 | $41,640 | $100,560 |
| 2024 | $948 | $164,320 | $34,700 | $129,620 |
| 2023 | $948 | $145,360 | $34,700 | $110,660 |
| 2022 | $2,607 | $104,280 | $34,700 | $69,580 |
| 2021 | $2,751 | $104,280 | $34,700 | $69,580 |
| 2020 | $2,829 | $104,280 | $34,700 | $69,580 |
| 2019 | $2,877 | $101,120 | $34,700 | $66,420 |
| 2018 | $2,372 | $87,220 | $13,880 | $73,340 |
| 2017 | $2,372 | $87,220 | $13,880 | $73,340 |
| 2016 | $1,616 | $59,410 | $13,880 | $45,530 |
| 2015 | $492 | $55,620 | $13,880 | $41,740 |
| 2014 | $492 | $47,400 | $13,880 | $33,520 |
Source: Public Records
Map
Nearby Homes
- 5881 Preston View Blvd Unit 159
- 5881 Preston View Blvd Unit 215
- 5840 Spring Valley Rd Unit 803
- 5840 Spring Valley Rd Unit 810
- 5840 Spring Valley Rd Unit 802
- 5840 Spring Valley Rd Unit 1510
- 5814 Preston Valley Dr
- 5813 Preston Valley Dr
- 6181 Preston Creek Ct
- 13411 Forestway Dr
- 5590 Spring Valley Rd Unit C205
- 6275 Preston Creek Dr
- 6065 Dilbeck Ln
- 5550 Spring Valley Rd Unit D16
- 5550 Spring Valley Rd Unit E22
- 5550 Spring Valley Rd Unit H15
- 5626 Preston Oaks Rd Unit 51C
- 5626 Preston Oaks Rd Unit 46C
- 5626 Preston Oaks Rd Unit 42B
- 5626 Preston Oaks Rd Unit 22C
- 5881 Preston View Blvd Unit 218
- 5881 Preston View Blvd Unit 227
- 5881 Preston View Blvd Unit 133
- 5881 Preston View Blvd Unit 175
- 5881 Preston View Blvd Unit 166
- 5881 Preston View Blvd Unit 266
- 5881 Preston View Blvd Unit 154
- 5881 Preston View Blvd Unit 255
- 5881 Preston View Blvd Unit 177
- 5881 Preston View Blvd Unit 164
- 5881 Preston View Blvd Unit 274
- 5881 Preston View Blvd Unit 158
- 5881 Preston View Blvd Unit 264
- 5881 Preston View Blvd Unit 172
- 5881 Preston View Blvd Unit 270
- 5881 Preston View Blvd Unit 173
- 5881 Preston View Blvd Unit 156
- 5881 Preston View Blvd Unit 278
- 5881 Preston View Blvd Unit 276
- 5881 Preston View Blvd Unit 139