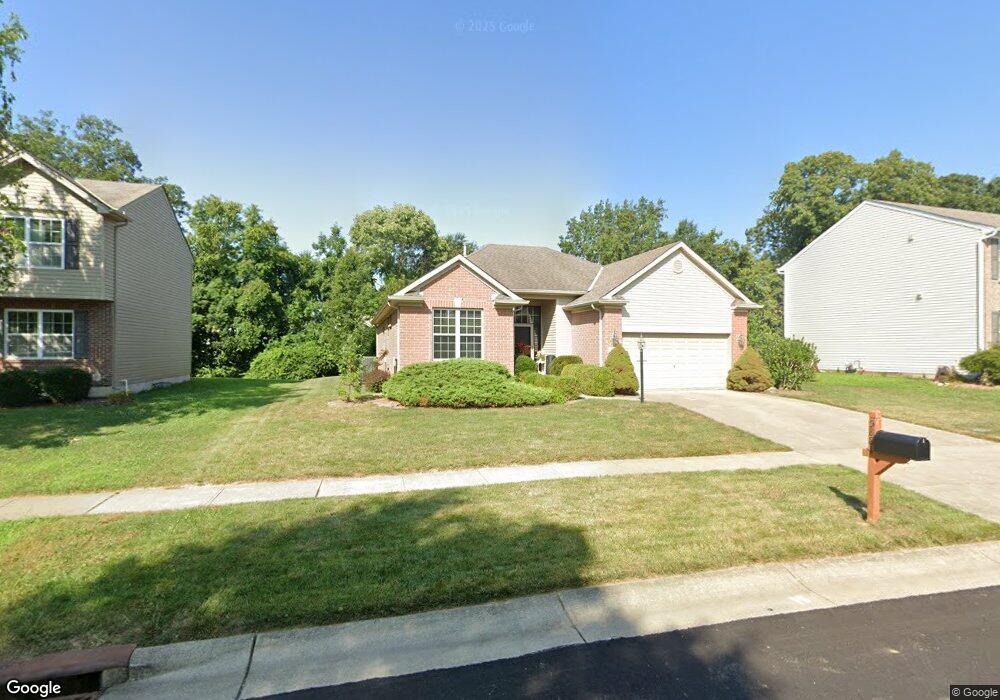
5881 Turning Leaf Way Maineville, OH 45039
Hamilton Township NeighborhoodEstimated Value: $356,634 - $394,000
3
Beds
2
Baths
1,541
Sq Ft
$243/Sq Ft
Est. Value
About This Home
This home is located at 5881 Turning Leaf Way, Maineville, OH 45039 and is currently estimated at $373,909, approximately $242 per square foot. 5881 Turning Leaf Way is a home located in Warren County with nearby schools including Little Miami Early Childhood Center, Little Miami Intermediate Middle School, and Little Miami Middle School.
Ownership History
Date
Name
Owned For
Owner Type
Purchase Details
Closed on
Apr 30, 2010
Sold by
Forty One Corporation
Bought by
Wintermeyer Charles F and Wintermeyer Mary S
Current Estimated Value
Home Financials for this Owner
Home Financials are based on the most recent Mortgage that was taken out on this home.
Original Mortgage
$142,400
Outstanding Balance
$95,445
Interest Rate
5.05%
Mortgage Type
New Conventional
Estimated Equity
$278,464
Purchase Details
Closed on
Jan 21, 2010
Sold by
Meyer Builders Douglas Homes Ltd
Bought by
Forty One Corporation
Purchase Details
Closed on
Jul 30, 2004
Sold by
Turning Leaf Llc
Bought by
Meyer Builders Douglas Homes Ltd
Home Financials for this Owner
Home Financials are based on the most recent Mortgage that was taken out on this home.
Original Mortgage
$16,000,000
Interest Rate
5.89%
Mortgage Type
Credit Line Revolving
Create a Home Valuation Report for This Property
The Home Valuation Report is an in-depth analysis detailing your home's value as well as a comparison with similar homes in the area
Home Values in the Area
Average Home Value in this Area
Purchase History
| Date | Buyer | Sale Price | Title Company |
|---|---|---|---|
| Wintermeyer Charles F | $178,000 | Attorney | |
| Forty One Corporation | $143,334 | None Available | |
| Meyer Builders Douglas Homes Ltd | $135,833 | First Title Agency Inc |
Source: Public Records
Mortgage History
| Date | Status | Borrower | Loan Amount |
|---|---|---|---|
| Open | Wintermeyer Charles F | $142,400 | |
| Previous Owner | Meyer Builders Douglas Homes Ltd | $16,000,000 |
Source: Public Records
Tax History Compared to Growth
Tax History
| Year | Tax Paid | Tax Assessment Tax Assessment Total Assessment is a certain percentage of the fair market value that is determined by local assessors to be the total taxable value of land and additions on the property. | Land | Improvement |
|---|---|---|---|---|
| 2024 | $4,554 | $101,920 | $28,000 | $73,920 |
| 2023 | $3,856 | $76,975 | $14,042 | $62,933 |
| 2022 | $3,811 | $76,976 | $14,042 | $62,934 |
| 2021 | $3,633 | $76,976 | $14,042 | $62,934 |
| 2020 | $3,608 | $65,233 | $11,900 | $53,333 |
| 2019 | $3,668 | $65,233 | $11,900 | $53,333 |
| 2018 | $3,593 | $65,233 | $11,900 | $53,333 |
| 2017 | $3,173 | $57,813 | $10,721 | $47,093 |
| 2016 | $3,248 | $57,813 | $10,721 | $47,093 |
| 2015 | $3,245 | $57,813 | $10,721 | $47,093 |
| 2014 | $3,368 | $53,040 | $9,840 | $43,200 |
| 2013 | $3,275 | $64,180 | $11,900 | $52,280 |
Source: Public Records
Map
Nearby Homes
- 5672 Wyntree Ct
- 619 Crabapple Ct
- 5717 Pepperridge Ct
- 161 Arbor Glen Ct
- 6076 Driftwood Ct
- 5708 Cochran Rd
- 6107 Driftwood Ct
- 261 Forest Edge Dr
- 668 Thornton Dr
- 5255 Red Flower Ln
- 792 Oak Forest Dr
- 678 Emerald Dr
- 723 Grande Oaks Dr
- 0 Deere Run Ln Unit 1836428
- 5481 Windsor Ct
- 721 Kingly Terrace
- 809 Emerald Dr
- 219 Chateau Valley Ln
- 6203 Silver Wood Dr
- 5079 Ross Ridge
- 5885 Turning Leaf Way
- 5877 Turning Leaf Way
- 5707 Wyntree Ct
- 5854 Pepperridge Ct
- 5889 Turning Leaf Way
- 5842 Pepperridge Ct
- 5864 Pepperridge Ct
- 486 Woodbine Ct
- 5830 Pepperridge Ct
- 5872 Turning Leaf Way
- 5703 Wyntree Ct
- 5893 Turning Leaf Way
- 498 Woodbine Ct
- 5878 Pepperridge Ct
- 5814 Pepperridge Ct
- 5897 Turning Leaf Way
- 5699 Wyntree Ct
- 5873 Turning Leaf Way
- 5866 Turning Leaf Way
- 512 Woodbine Ct