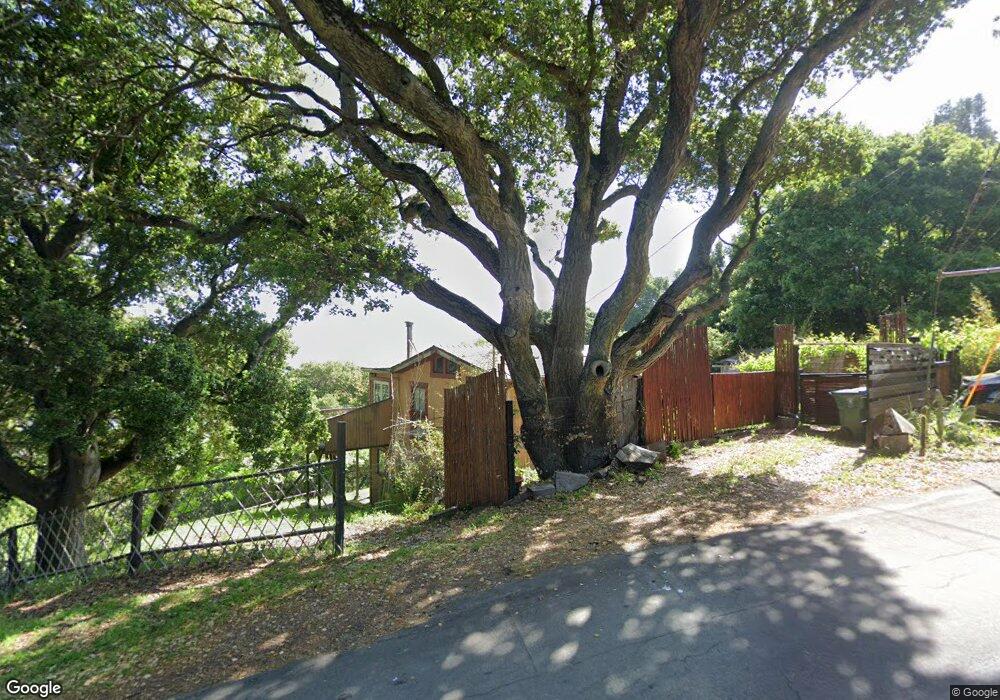
5883 Skyline Dr El Sobrante, CA 94803
El Sobrante Manor NeighborhoodEstimated Value: $531,000 - $620,917
1
Bed
1
Bath
769
Sq Ft
$751/Sq Ft
Est. Value
About This Home
This home is located at 5883 Skyline Dr, El Sobrante, CA 94803 and is currently estimated at $577,479, approximately $750 per square foot. 5883 Skyline Dr is a home located in Contra Costa County with nearby schools including Valley View Elementary School, Betty Reid Soskin Middle School, and De Anza Senior High School.
Ownership History
Date
Name
Owned For
Owner Type
Purchase Details
Closed on
Dec 20, 2016
Sold by
Sim Dianne M
Bought by
Bond Jane
Current Estimated Value
Home Financials for this Owner
Home Financials are based on the most recent Mortgage that was taken out on this home.
Original Mortgage
$446,580
Outstanding Balance
$361,161
Interest Rate
3.57%
Mortgage Type
FHA
Estimated Equity
$216,318
Purchase Details
Closed on
Jul 18, 2007
Sold by
Sim Dianne M
Bought by
Sim Dianne M
Home Financials for this Owner
Home Financials are based on the most recent Mortgage that was taken out on this home.
Original Mortgage
$103,000
Interest Rate
6.73%
Mortgage Type
Credit Line Revolving
Purchase Details
Closed on
Apr 25, 2006
Sold by
Sim Dianne
Bought by
Sim Dianne M
Purchase Details
Closed on
Jun 17, 2004
Sold by
Stpierre Carol A and Sim Dianne
Bought by
Sim Dianne
Home Financials for this Owner
Home Financials are based on the most recent Mortgage that was taken out on this home.
Original Mortgage
$219,000
Interest Rate
6.29%
Mortgage Type
Purchase Money Mortgage
Create a Home Valuation Report for This Property
The Home Valuation Report is an in-depth analysis detailing your home's value as well as a comparison with similar homes in the area
Home Values in the Area
Average Home Value in this Area
Purchase History
| Date | Buyer | Sale Price | Title Company |
|---|---|---|---|
| Bond Jane | $462,000 | North American Title Co Inc | |
| Sim Dianne M | -- | Chicago Title Co | |
| Sim Dianne M | -- | None Available | |
| Sim Dianne | $109,500 | Financial Title Company |
Source: Public Records
Mortgage History
| Date | Status | Borrower | Loan Amount |
|---|---|---|---|
| Open | Bond Jane | $446,580 | |
| Previous Owner | Sim Dianne M | $103,000 | |
| Previous Owner | Sim Dianne | $219,000 |
Source: Public Records
Tax History
| Year | Tax Paid | Tax Assessment Tax Assessment Total Assessment is a certain percentage of the fair market value that is determined by local assessors to be the total taxable value of land and additions on the property. | Land | Improvement |
|---|---|---|---|---|
| 2025 | $7,058 | $536,182 | $406,201 | $129,981 |
| 2024 | $6,769 | $525,670 | $398,237 | $127,433 |
| 2023 | $6,769 | $515,364 | $390,429 | $124,935 |
| 2022 | $6,701 | $505,260 | $382,774 | $122,486 |
| 2021 | $6,705 | $495,354 | $375,269 | $120,085 |
| 2019 | $6,316 | $480,664 | $364,140 | $116,524 |
| 2018 | $6,107 | $471,240 | $357,000 | $114,240 |
| 2017 | $6,002 | $462,000 | $350,000 | $112,000 |
| 2016 | $4,228 | $310,000 | $171,347 | $138,653 |
| 2015 | -- | $250,000 | $138,184 | $111,816 |
| 2014 | $3,078 | $211,000 | $116,626 | $94,374 |
Source: Public Records
Map
Nearby Homes
- 6078 Skyline Dr
- 2420 Tomar Ct
- 2134 Whippoorwill Ct
- 6070 Skyline Dr
- 2331 Olinda Ct
- 0 Sobrante Ave Unit 41123160
- 2537 Simas Ave
- 3716 Painted Pony Rd
- 5264 Sunset Dr
- 2312 Granada Ct
- 5260a Sunset Dr
- 2410 Colusa St
- 3505 Morningside Dr
- 2651 Tamalpais Dr
- 5024 Escalon Cir
- 1923 Thompson Ln
- 2654 Tamalpais Dr Unit 38
- 209 N Rancho Place
- 213 N Rancho Place
- 5136 Argyle Rd
- 5880 Skyline Dr
- 5893 Skyline Dr
- 5884 Skyline Dr
- 5910 Skyline Dr
- 5861 Skyline Dr
- 5905 Skyline Dr
- 5920 Skyline Dr
- 5851 Skyline Dr
- 5915 Monte Verde Rd
- 5959 Skyline Dr
- 7070 Monte Verde Rd
- 6890 Monte Verde Rd
- 5800 Skyline Dr
- 7010 Monte Verde Rd
- 7050 Monte Verde Rd
- 5969 Skyline Dr
- 5741 Sobrante Ave
- 7000 Monte Verde Rd
- 9 Live Oak Cir
- 6012 Monte Verde Rd
Your Personal Tour Guide
Ask me questions while you tour the home.