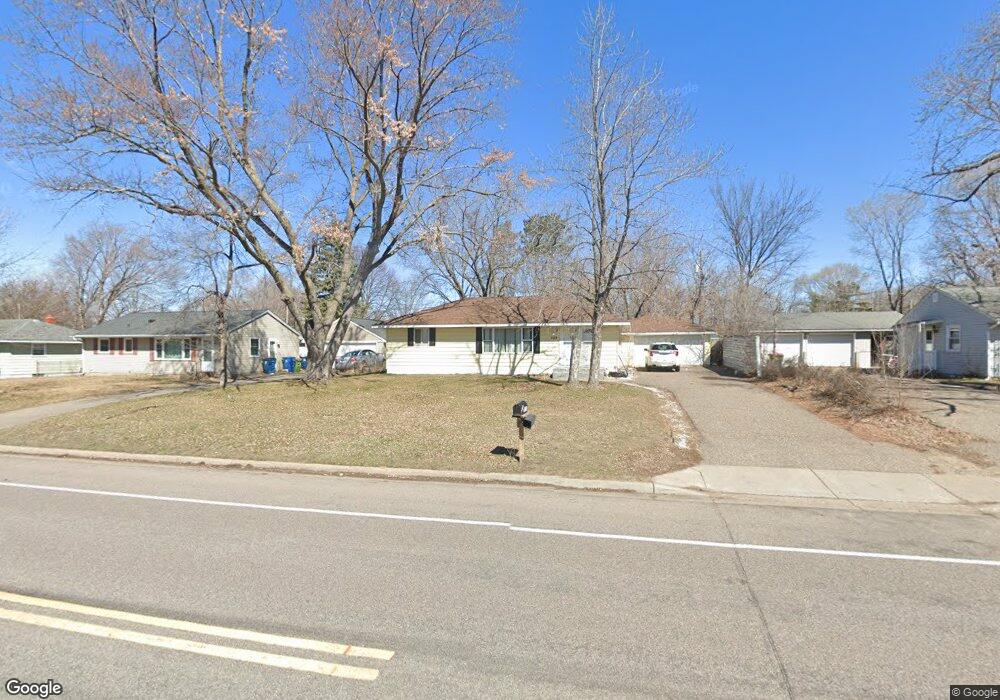
589 81st Ave NE Minneapolis, MN 55432
Estimated Value: $297,617 - $328,000
3
Beds
1
Bath
1,920
Sq Ft
$165/Sq Ft
Est. Value
About This Home
This home is located at 589 81st Ave NE, Minneapolis, MN 55432 and is currently estimated at $316,404, approximately $164 per square foot. 589 81st Ave NE is a home located in Anoka County with nearby schools including Park Terrace Elementary School, Westwood Intermediate and Middle School, and Grace Lutheran School.
Ownership History
Date
Name
Owned For
Owner Type
Purchase Details
Closed on
Sep 26, 2019
Sold by
Maggiolo Danielle
Bought by
Alkarblaee Sura A and Juaifari Mostafa
Current Estimated Value
Home Financials for this Owner
Home Financials are based on the most recent Mortgage that was taken out on this home.
Original Mortgage
$221,906
Outstanding Balance
$195,384
Interest Rate
3.75%
Mortgage Type
FHA
Estimated Equity
$121,020
Purchase Details
Closed on
Apr 29, 2016
Sold by
Smalley Scott
Bought by
Maggiolo Danielle
Home Financials for this Owner
Home Financials are based on the most recent Mortgage that was taken out on this home.
Original Mortgage
$5,500
Interest Rate
3.71%
Mortgage Type
Unknown
Purchase Details
Closed on
Sep 26, 1997
Sold by
Solberg Leslie J
Bought by
Garner Merlin R
Purchase Details
Closed on
Jun 21, 1990
Sold by
Radford J David and Radford Myrtle J
Bought by
Solberg Tor and Solberg Leslie J
Create a Home Valuation Report for This Property
The Home Valuation Report is an in-depth analysis detailing your home's value as well as a comparison with similar homes in the area
Home Values in the Area
Average Home Value in this Area
Purchase History
| Date | Buyer | Sale Price | Title Company |
|---|---|---|---|
| Alkarblaee Sura A | $226,000 | Partners Title Llc | |
| Maggiolo Danielle | $179,900 | Title Specialists Inc | |
| Garner Merlin R | $88,900 | -- | |
| Solberg Tor | $5,605 | -- |
Source: Public Records
Mortgage History
| Date | Status | Borrower | Loan Amount |
|---|---|---|---|
| Open | Alkarblaee Sura A | $221,906 | |
| Previous Owner | Maggiolo Danielle | $5,500 | |
| Previous Owner | Maggiolo Danielle | $176,641 |
Source: Public Records
Tax History Compared to Growth
Tax History
| Year | Tax Paid | Tax Assessment Tax Assessment Total Assessment is a certain percentage of the fair market value that is determined by local assessors to be the total taxable value of land and additions on the property. | Land | Improvement |
|---|---|---|---|---|
| 2025 | $2,635 | $248,400 | $64,500 | $183,900 |
| 2024 | $2,635 | $239,900 | $58,600 | $181,300 |
| 2023 | $2,532 | $252,200 | $70,600 | $181,600 |
| 2022 | $2,412 | $249,500 | $58,000 | $191,500 |
| 2021 | $2,137 | $201,600 | $48,300 | $153,300 |
| 2020 | $2,319 | $181,600 | $51,900 | $129,700 |
| 2019 | $2,427 | $184,500 | $56,600 | $127,900 |
| 2018 | $2,003 | $167,300 | $0 | $0 |
| 2017 | $1,926 | $151,500 | $0 | $0 |
| 2016 | $2,620 | $135,100 | $0 | $0 |
| 2015 | $2,072 | $135,100 | $48,200 | $86,900 |
| 2014 | -- | $123,900 | $47,500 | $76,400 |
Source: Public Records
Map
Nearby Homes
- 8032 Madison St NE
- 601 79th Ave NE
- 358 81st Ave NE
- 8032 Van Buren St NE
- 857 81st Ave NE
- 516 84th Ave NE
- 8351 6th St NE
- 8380 6th St NE
- 7811 Jackson St NE
- 795 84th Ave NE
- 7733 Quincy St NE
- 7720 Van Buren St NE
- 7717 Able St NE
- 8157 Taylor St NE
- 8132 Fillmore St NE
- 881 Manor Dr NE
- 350 Sanburnol Dr NE
- 1010 North Cir NE
- 7436 West Cir NE
- 380 74th Ave NE
- 575 81st Ave NE
- 603 81st Ave NE
- 590 Ballantyne Ln NE
- 561 81st Ave NE
- 617 81st Ave NE
- 580 Ballantyne Ln NE
- 8092 Jefferson St NE
- 574 Ballantyne Ln NE
- 8099 Jefferson St NE
- 616 Ballantyne Ln NE
- 547 81st Ave NE
- 637 81st Ave NE
- 8099 Washington St NE
- 8074 Jefferson St NE
- 560 Ballantyne Ln NE
- 8085 Jefferson St NE
- 630 Ballantyne Ln NE
- 533 81st Ave NE
- 8098 Madison St NE
- 8073 Washington St NE