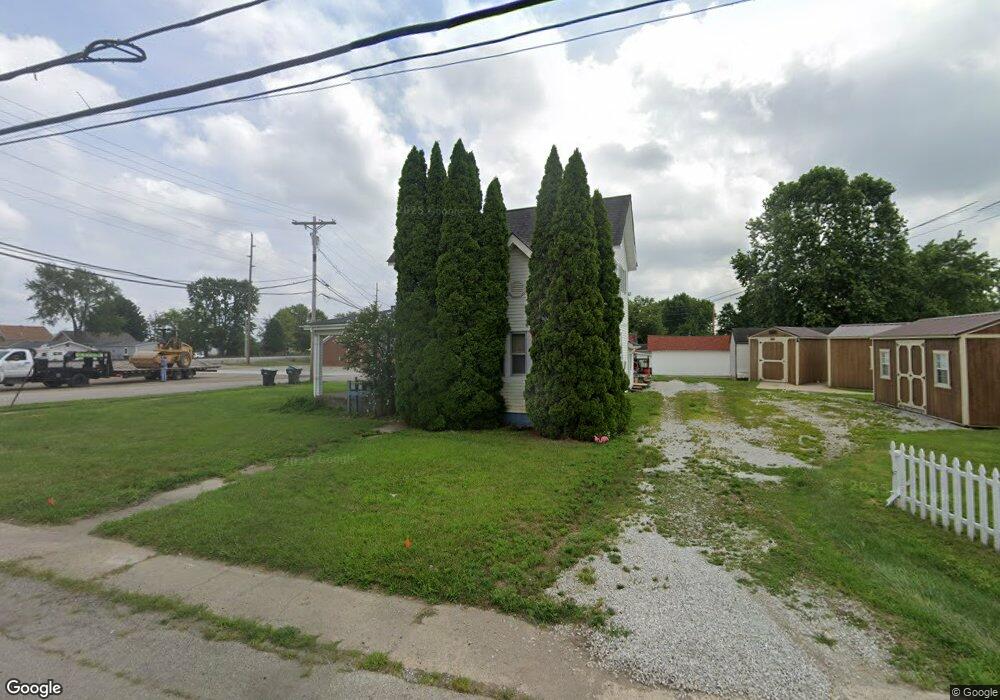
589 E Main St Whiteland, IN 46184
Estimated Value: $232,000 - $243,000
3
Beds
3
Baths
1,785
Sq Ft
$133/Sq Ft
Est. Value
About This Home
This home is located at 589 E Main St, Whiteland, IN 46184 and is currently estimated at $237,500, approximately $133 per square foot. 589 E Main St is a home located in Johnson County with nearby schools including Whiteland Elementary School, Clark-Pleasant Middle School, and Whiteland Community High School.
Ownership History
Date
Name
Owned For
Owner Type
Purchase Details
Closed on
Apr 29, 2022
Sold by
Blackacre Llc
Bought by
Sunrise Management Llc
Current Estimated Value
Home Financials for this Owner
Home Financials are based on the most recent Mortgage that was taken out on this home.
Original Mortgage
$252,000
Outstanding Balance
$237,518
Interest Rate
4.42%
Mortgage Type
Credit Line Revolving
Estimated Equity
-$18
Create a Home Valuation Report for This Property
The Home Valuation Report is an in-depth analysis detailing your home's value as well as a comparison with similar homes in the area
Home Values in the Area
Average Home Value in this Area
Purchase History
| Date | Buyer | Sale Price | Title Company |
|---|---|---|---|
| Sunrise Management Llc | $205,000 | Ata National Title |
Source: Public Records
Mortgage History
| Date | Status | Borrower | Loan Amount |
|---|---|---|---|
| Open | Sunrise Management Llc | $252,000 |
Source: Public Records
Tax History
| Year | Tax Paid | Tax Assessment Tax Assessment Total Assessment is a certain percentage of the fair market value that is determined by local assessors to be the total taxable value of land and additions on the property. | Land | Improvement |
|---|---|---|---|---|
| 2025 | $2,111 | $204,800 | $33,900 | $170,900 |
| 2024 | $3,522 | $168,600 | $34,400 | $134,200 |
| 2023 | $3,412 | $163,600 | $34,400 | $129,200 |
| 2022 | $2,788 | $134,200 | $22,900 | $111,300 |
| 2021 | $2,528 | $121,200 | $22,900 | $98,300 |
| 2020 | $2,334 | $111,200 | $22,900 | $88,300 |
| 2019 | $2,334 | $111,200 | $22,900 | $88,300 |
| 2018 | $2,215 | $108,600 | $17,600 | $91,000 |
| 2017 | $2,160 | $107,500 | $17,600 | $89,900 |
| 2016 | $2,150 | $107,500 | $17,600 | $89,900 |
| 2014 | $1,944 | $97,200 | $19,600 | $77,600 |
| 2013 | $1,944 | $97,200 | $19,600 | $77,600 |
Source: Public Records
Map
Nearby Homes
- 650 E Pearl St
- 810 Pearl St
- 197 Briar Hill Dr
- 111 Ames Dr
- 131 Ames Dr
- 140 Ames Dr
- 801 Blaine Dr
- 60 Wilkins St
- 830 Saddlebrook Farms Blvd
- 40 Wilkins St
- 50 Wilkins St
- 657 Whiteland Rd
- 545 Whiteland Rd
- 70 Wilkins St
- 170 Ames Dr
- 181 Ames Dr
- 0 N 200 (Honey Creek Rd ) W Unit MBR21845718
- 930 Saddlebrook Farms Blvd
- 30 Benfield Dr
- 950 Saddlebrook Farms Blvd
Your Personal Tour Guide
Ask me questions while you tour the home.