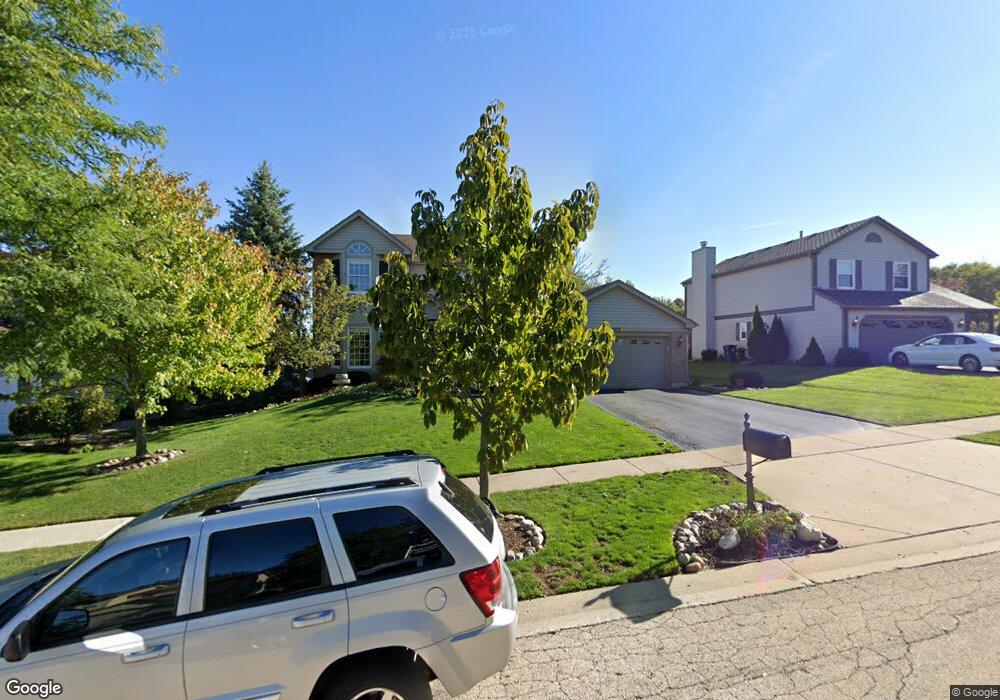
589 Flora Dr Algonquin, IL 60102
High Hill Farms NeighborhoodEstimated Value: $418,626 - $494,000
4
Beds
3
Baths
2,598
Sq Ft
$180/Sq Ft
Est. Value
About This Home
This home is located at 589 Flora Dr, Algonquin, IL 60102 and is currently estimated at $467,907, approximately $180 per square foot. 589 Flora Dr is a home located in McHenry County with nearby schools including Westfield Community School, Kenneth E Neubert Elementary School, and Harry D Jacobs High School.
Ownership History
Date
Name
Owned For
Owner Type
Purchase Details
Closed on
Aug 15, 1999
Sold by
Ross Alan S and Ross Barbara L
Bought by
Costa Scott J and Costa Patricia A
Current Estimated Value
Home Financials for this Owner
Home Financials are based on the most recent Mortgage that was taken out on this home.
Original Mortgage
$205,000
Outstanding Balance
$59,463
Interest Rate
7.77%
Estimated Equity
$408,444
Purchase Details
Closed on
Apr 30, 1996
Sold by
United Homes Inc
Bought by
Ross Alan S and Ross Barbara L
Home Financials for this Owner
Home Financials are based on the most recent Mortgage that was taken out on this home.
Original Mortgage
$173,750
Interest Rate
7.86%
Create a Home Valuation Report for This Property
The Home Valuation Report is an in-depth analysis detailing your home's value as well as a comparison with similar homes in the area
Home Values in the Area
Average Home Value in this Area
Purchase History
| Date | Buyer | Sale Price | Title Company |
|---|---|---|---|
| Costa Scott J | $230,000 | Attorneys Title Guaranty Fun | |
| Ross Alan S | $210,000 | Chicago Title Insurance Co |
Source: Public Records
Mortgage History
| Date | Status | Borrower | Loan Amount |
|---|---|---|---|
| Open | Costa Scott J | $205,000 | |
| Previous Owner | Ross Alan S | $173,750 |
Source: Public Records
Tax History
| Year | Tax Paid | Tax Assessment Tax Assessment Total Assessment is a certain percentage of the fair market value that is determined by local assessors to be the total taxable value of land and additions on the property. | Land | Improvement |
|---|---|---|---|---|
| 2024 | $10,071 | $136,736 | $23,543 | $113,193 |
| 2023 | $9,568 | $122,293 | $21,056 | $101,237 |
| 2022 | $10,368 | $126,893 | $21,044 | $105,849 |
| 2021 | $9,957 | $118,216 | $19,605 | $98,611 |
| 2020 | $9,700 | $114,031 | $18,911 | $95,120 |
| 2019 | $9,471 | $109,141 | $18,100 | $91,041 |
| 2018 | $9,038 | $100,824 | $16,721 | $84,103 |
| 2017 | $8,861 | $94,982 | $15,752 | $79,230 |
| 2016 | $8,737 | $89,085 | $14,774 | $74,311 |
| 2013 | -- | $79,192 | $13,783 | $65,409 |
Source: Public Records
Map
Nearby Homes
- 700 Fairfield Ln
- 1820 Crofton Dr
- 1920 Jester Ln
- 681 Majestic Dr
- 760 Regal Ln
- 1002 Interloch Ct Unit 152
- 1431 Essex St
- 135 Arquilla Dr
- 1354 Essex St Unit 2
- 145 S Oakleaf Rd
- 13 Brian Ct
- 7 Falcon Ridge Ct
- 1 N Hubbard St
- SWC Talaga and Algonquin Rd
- 2380 Dawson Ln Unit 165
- 909 Roger St
- 1157 Sawmill Ln
- 730 Chestnut Ct
- 615 Harper Dr
- LOT 3 Blackhawk Dr
Your Personal Tour Guide
Ask me questions while you tour the home.