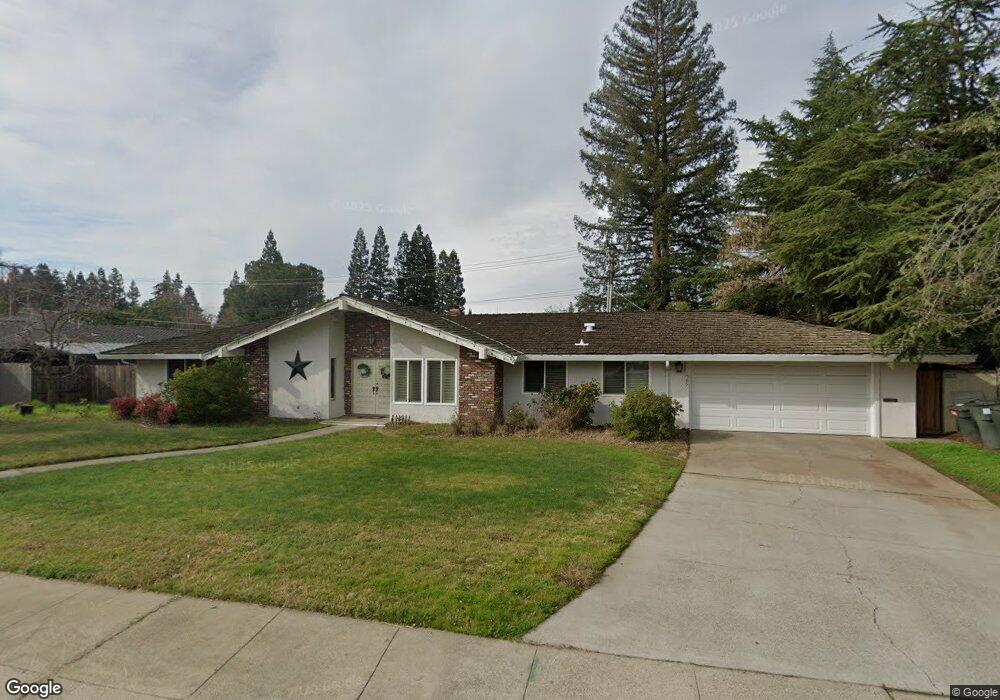
589 Kevington Ct Sacramento, CA 95864
Wilhaggin del Dayo NeighborhoodEstimated Value: $657,000 - $1,054,000
4
Beds
2
Baths
2,013
Sq Ft
$444/Sq Ft
Est. Value
About This Home
This home is located at 589 Kevington Ct, Sacramento, CA 95864 and is currently estimated at $894,055, approximately $444 per square foot. 589 Kevington Ct is a home located in Sacramento County with nearby schools including Sierra Oaks K-8, Encina Preparatory High School, and Rio Americano High School.
Ownership History
Date
Name
Owned For
Owner Type
Purchase Details
Closed on
Oct 11, 2005
Sold by
In Hannah Erica and In Gloria A Waggoner Revocable
Bought by
Hannah Erica and Waggoner William
Current Estimated Value
Purchase Details
Closed on
Apr 26, 2000
Sold by
Mansoury Sam Nasser
Bought by
Wu Yue and Chen Fangfei
Purchase Details
Closed on
Dec 30, 1998
Sold by
Mansoury Ashkon
Bought by
Mansoury Sam Nasser
Purchase Details
Closed on
Jul 15, 1998
Sold by
Mansoury Sam Nasser
Bought by
Mansoury Ashkon
Purchase Details
Closed on
May 13, 1998
Sold by
Mansoury Ashkon
Bought by
Mansoury Sam Nasser
Purchase Details
Closed on
Mar 10, 1997
Sold by
Astorino Ralph A and Astorino Joy L
Bought by
Mansoury Sam Nasser and Mansoury Ashkon
Purchase Details
Closed on
Nov 1, 1996
Sold by
Astorino Ralph A and Astorino Joy L
Bought by
Astorino Ralph A and Astorino Joy L
Create a Home Valuation Report for This Property
The Home Valuation Report is an in-depth analysis detailing your home's value as well as a comparison with similar homes in the area
Home Values in the Area
Average Home Value in this Area
Purchase History
| Date | Buyer | Sale Price | Title Company |
|---|---|---|---|
| Hannah Erica | -- | -- | |
| Wu Yue | $259,000 | Old Republic Title Company | |
| Mansoury Sam Nasser | -- | -- | |
| Mansoury Ashkon | -- | -- | |
| Mansoury Sam Nasser | -- | -- | |
| Mansoury Sam Nasser | $227,500 | Chicago Title Co | |
| Astorino Ralph A | -- | -- |
Source: Public Records
Tax History Compared to Growth
Tax History
| Year | Tax Paid | Tax Assessment Tax Assessment Total Assessment is a certain percentage of the fair market value that is determined by local assessors to be the total taxable value of land and additions on the property. | Land | Improvement |
|---|---|---|---|---|
| 2025 | $4,768 | $398,054 | $329,211 | $68,843 |
| 2024 | $4,768 | $390,250 | $322,756 | $67,494 |
| 2023 | $4,648 | $382,599 | $316,428 | $66,171 |
| 2022 | $4,623 | $375,098 | $310,224 | $64,874 |
| 2021 | $4,548 | $367,744 | $304,142 | $63,602 |
| 2020 | $4,464 | $363,974 | $301,024 | $62,950 |
| 2019 | $4,376 | $356,838 | $295,122 | $61,716 |
| 2018 | $4,343 | $349,842 | $289,336 | $60,506 |
| 2017 | $4,284 | $342,983 | $283,663 | $59,320 |
| 2016 | $4,004 | $336,258 | $278,101 | $58,157 |
| 2015 | $3,936 | $331,208 | $273,924 | $57,284 |
| 2014 | $3,854 | $324,721 | $268,559 | $56,162 |
Source: Public Records
Map
Nearby Homes
- 631 Wilhaggin Dr
- 740 Coronado Blvd
- 612 Lake Wilhaggin Dr
- 670 Lake Wilhaggin Dr
- 650 Mystic Ln
- 741 Estates Dr
- 800 Watt Ave
- 3399 Barberry Ln
- 3424 Cosmos Ave
- 760 Cortlandt Dr
- 3511 La Habra Way
- 813 Columbia Dr
- 3418 Clemens Way
- 1 Usfs 8bn54 Rd
- 4240 Fair Oaks Blvd
- 3530 Bodega Ct
- 3340 American River Dr
- 557 Crocker Rd
- 8828 La Riviera Dr Unit C
- 651 Laurel Dr
- 579 Kevington Ct
- 550 Pajaro Ct
- 540 Pajaro Ct
- 590 Kevington Ct
- 580 Kevington Ct
- 569 Kevington Ct
- 530 Pajaro Ct
- 560 Pajaro Ct
- 3801 Fair Oaks Blvd
- 570 Kevington Ct
- 3781 Fair Oaks Blvd
- 535 Pajaro Ct
- 520 Pajaro Ct
- 570 Pajaro Ct
- 3851 Fair Oaks Blvd
- 3820 Fair Oaks Blvd
- 565 Pajaro Ct
- 559 Kevington Ct
- 521 Pajaro Ct
- 650 Coronado Blvd