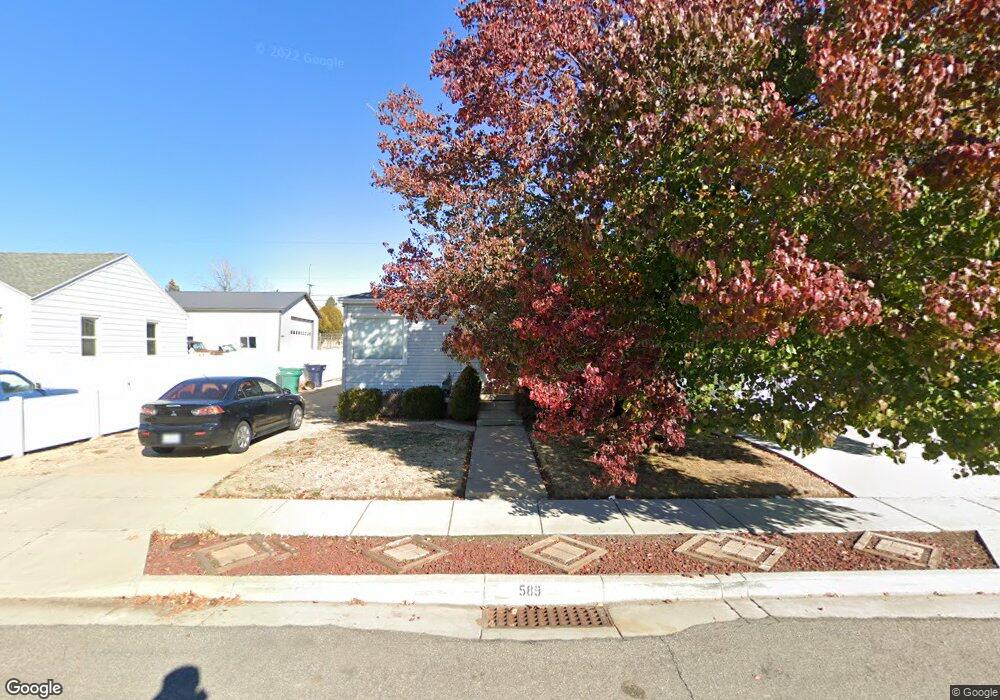
589 Maple St Clearfield, UT 84015
Estimated Value: $360,000 - $399,000
4
Beds
1
Bath
1,560
Sq Ft
$240/Sq Ft
Est. Value
About This Home
This home is located at 589 Maple St, Clearfield, UT 84015 and is currently estimated at $373,864, approximately $239 per square foot. 589 Maple St is a home located in Davis County with nearby schools including Wasatch Elementary School, North Davis Junior High School, and Clearfield High School.
Ownership History
Date
Name
Owned For
Owner Type
Purchase Details
Closed on
Nov 8, 2021
Sold by
Smith Michael E
Bought by
Johns Randall
Current Estimated Value
Home Financials for this Owner
Home Financials are based on the most recent Mortgage that was taken out on this home.
Original Mortgage
$365,108
Outstanding Balance
$333,330
Interest Rate
2.88%
Mortgage Type
VA
Estimated Equity
$40,534
Purchase Details
Closed on
Oct 30, 2009
Sold by
Smith Michael E
Bought by
Smith Michael E and Wise Merdene
Purchase Details
Closed on
Apr 26, 2001
Sold by
Thornock O Wayne and Thornock Euvola M
Bought by
Thornock Management Services #Iv Llc
Create a Home Valuation Report for This Property
The Home Valuation Report is an in-depth analysis detailing your home's value as well as a comparison with similar homes in the area
Home Values in the Area
Average Home Value in this Area
Purchase History
| Date | Buyer | Sale Price | Title Company |
|---|---|---|---|
| Johns Randall | -- | Us Title Company Of Utah | |
| Smith Michael E | -- | None Available | |
| Thornock Management Services #Iv Llc | -- | -- |
Source: Public Records
Mortgage History
| Date | Status | Borrower | Loan Amount |
|---|---|---|---|
| Open | Johns Randall | $365,108 |
Source: Public Records
Tax History
| Year | Tax Paid | Tax Assessment Tax Assessment Total Assessment is a certain percentage of the fair market value that is determined by local assessors to be the total taxable value of land and additions on the property. | Land | Improvement |
|---|---|---|---|---|
| 2025 | $1,964 | $176,000 | $75,188 | $100,812 |
| 2024 | $1,938 | $174,900 | $71,862 | $103,038 |
| 2023 | $1,805 | $299,000 | $114,709 | $184,291 |
| 2022 | $1,921 | $172,150 | $65,519 | $106,631 |
| 2021 | $1,558 | $211,000 | $71,012 | $139,988 |
| 2020 | $1,383 | $186,000 | $59,995 | $126,005 |
| 2019 | $1,334 | $177,000 | $61,869 | $115,131 |
| 2018 | $1,191 | $154,000 | $52,169 | $101,831 |
| 2016 | $1,045 | $70,620 | $22,033 | $48,587 |
| 2015 | $967 | $62,315 | $22,033 | $40,282 |
| 2014 | $861 | $56,273 | $22,033 | $34,240 |
| 2013 | -- | $47,016 | $22,719 | $24,297 |
Source: Public Records
Map
Nearby Homes
Your Personal Tour Guide
Ask me questions while you tour the home.