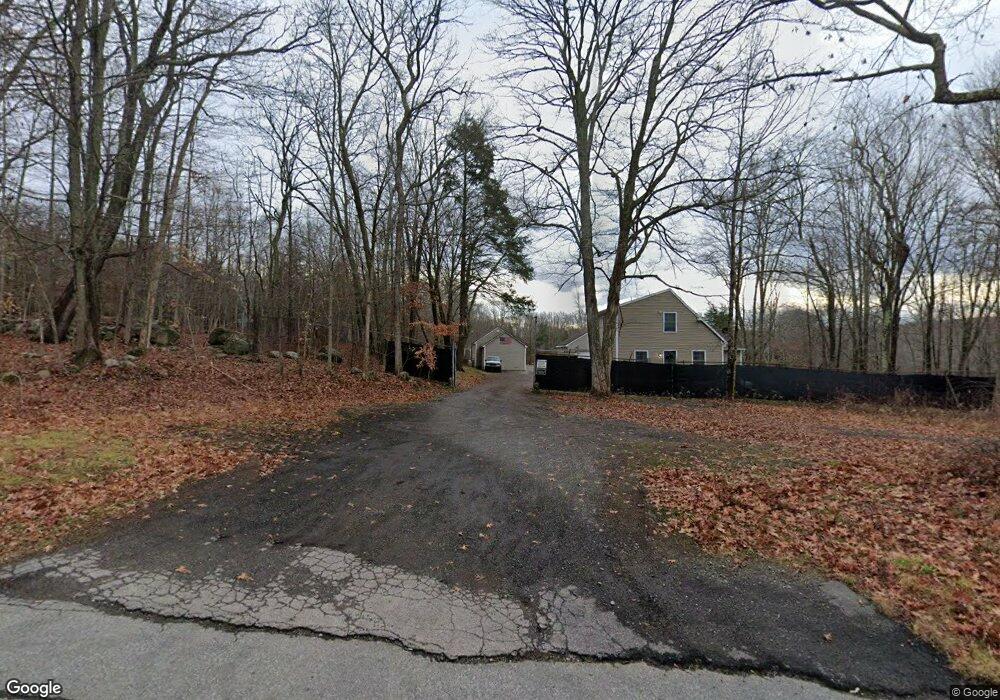
589 W Main St Amston, CT 06231
Estimated Value: $402,750 - $489,000
2
Beds
1
Bath
1,281
Sq Ft
$349/Sq Ft
Est. Value
About This Home
This home is located at 589 W Main St, Amston, CT 06231 and is currently estimated at $447,188, approximately $349 per square foot. 589 W Main St is a home located in Tolland County with nearby schools including Gilead Hill School, Hebron Elementary School, and RHAM Middle School.
Ownership History
Date
Name
Owned For
Owner Type
Purchase Details
Closed on
Jan 21, 2020
Sold by
Savy Ralph A and Savy Travis M
Bought by
Fournier Dillon
Current Estimated Value
Home Financials for this Owner
Home Financials are based on the most recent Mortgage that was taken out on this home.
Original Mortgage
$270,019
Outstanding Balance
$239,168
Interest Rate
3.73%
Mortgage Type
FHA
Estimated Equity
$208,020
Purchase Details
Closed on
Aug 14, 1987
Sold by
Landon John
Bought by
Savy Ilena
Create a Home Valuation Report for This Property
The Home Valuation Report is an in-depth analysis detailing your home's value as well as a comparison with similar homes in the area
Home Values in the Area
Average Home Value in this Area
Purchase History
| Date | Buyer | Sale Price | Title Company |
|---|---|---|---|
| Fournier Dillon | $275,000 | None Available | |
| Savy Ilena | $85,000 | -- |
Source: Public Records
Mortgage History
| Date | Status | Borrower | Loan Amount |
|---|---|---|---|
| Open | Fournier Dillon | $270,019 | |
| Previous Owner | Savy Ilena | $190,400 | |
| Previous Owner | Savy Ilena | $158,000 | |
| Previous Owner | Savy Ilena | $144,000 | |
| Previous Owner | Savy Ilena | $112,000 |
Source: Public Records
Tax History Compared to Growth
Tax History
| Year | Tax Paid | Tax Assessment Tax Assessment Total Assessment is a certain percentage of the fair market value that is determined by local assessors to be the total taxable value of land and additions on the property. | Land | Improvement |
|---|---|---|---|---|
| 2025 | $7,321 | $198,660 | $61,110 | $137,550 |
| 2024 | $6,854 | $198,660 | $61,110 | $137,550 |
| 2023 | $6,594 | $198,660 | $61,110 | $137,550 |
| 2022 | $6,298 | $198,660 | $61,110 | $137,550 |
| 2021 | $6,389 | $175,860 | $61,140 | $114,720 |
| 2020 | $6,389 | $175,860 | $61,140 | $114,720 |
| 2019 | $6,516 | $175,860 | $61,140 | $114,720 |
| 2018 | $6,584 | $175,860 | $61,140 | $114,720 |
| 2017 | $6,507 | $175,860 | $61,140 | $114,720 |
| 2016 | $6,564 | $184,170 | $96,460 | $87,710 |
| 2015 | $6,630 | $184,170 | $96,460 | $87,710 |
| 2014 | $6,584 | $184,170 | $96,460 | $87,710 |
Source: Public Records
Map
Nearby Homes
- 54 Stone House Rd
- 52 Sentinal Woods
- 465 Old Slocum Rd
- 25 Smith Farm Rd
- 103 Hebron Rd Unit 109
- 7 Caffyn Dr
- 11 Caffyn Dr
- 10 Phelps Rd
- 17 Ridgewood Dr
- 219 Martin Rd
- 51 Hebron Rd
- 218 Hope Valley Rd
- 49 S Main St
- 0 South Rd
- 14 Jeremy Way Unit 14
- 222 Gilead St
- 124 Joel Dr
- 1 Church St
- 2 Church St
- 125 Cheney Rd