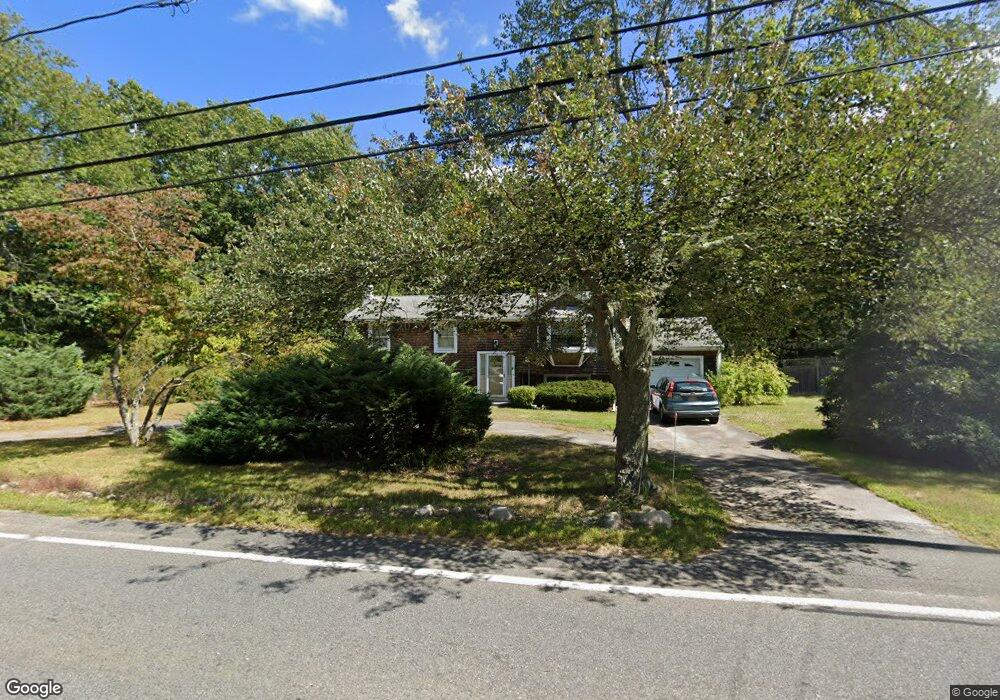
589 Whiting St Hanover, MA 02339
Estimated Value: $644,530 - $865,000
3
Beds
2
Baths
1,056
Sq Ft
$671/Sq Ft
Est. Value
About This Home
This home is located at 589 Whiting St, Hanover, MA 02339 and is currently estimated at $708,133, approximately $670 per square foot. 589 Whiting St is a home located in Plymouth County with nearby schools including Hanover High School, Calvary Chapel Academy, and Holy Family Elementary School.
Ownership History
Date
Name
Owned For
Owner Type
Purchase Details
Closed on
Aug 17, 1995
Sold by
Qualter Lthomas F and Qualter Robin A
Bought by
Bulman Linda O and Bulman Edward J
Current Estimated Value
Create a Home Valuation Report for This Property
The Home Valuation Report is an in-depth analysis detailing your home's value as well as a comparison with similar homes in the area
Home Values in the Area
Average Home Value in this Area
Purchase History
| Date | Buyer | Sale Price | Title Company |
|---|---|---|---|
| Bulman Linda O | $159,000 | -- |
Source: Public Records
Mortgage History
| Date | Status | Borrower | Loan Amount |
|---|---|---|---|
| Open | Bulman Linda O | $50,000 | |
| Open | Bulman Linda O | $175,000 | |
| Closed | Bulman Linda O | $50,000 |
Source: Public Records
Tax History
| Year | Tax Paid | Tax Assessment Tax Assessment Total Assessment is a certain percentage of the fair market value that is determined by local assessors to be the total taxable value of land and additions on the property. | Land | Improvement |
|---|---|---|---|---|
| 2025 | $7,279 | $589,400 | $270,100 | $319,300 |
| 2024 | $7,276 | $566,700 | $270,100 | $296,600 |
| 2023 | $7,151 | $530,100 | $245,500 | $284,600 |
| 2022 | $7,349 | $481,900 | $245,500 | $236,400 |
| 2021 | $7,148 | $437,700 | $223,100 | $214,600 |
| 2020 | $7,077 | $433,900 | $223,100 | $210,800 |
| 2019 | $6,625 | $403,700 | $223,100 | $180,600 |
| 2018 | $0 | $399,900 | $223,100 | $176,800 |
| 2017 | $6,233 | $377,300 | $211,100 | $166,200 |
| 2016 | $6,038 | $358,100 | $191,900 | $166,200 |
| 2015 | $5,267 | $326,100 | $191,900 | $134,200 |
Source: Public Records
Map
Nearby Homes
- 738 Whiting St
- 73 Shingle Mill Ln
- 18 Winterberry Ln
- 206-208 Hinghm St
- 8 Blueberry Ct
- 5 Blueberry Ct
- 36 Bayberry Ln
- 55 Turner Rd
- 18 Colby St
- 50 Village Ln
- 46 Brookwood Rd
- 14 Pleasant View Park
- 436 E Water St
- 535 Webster St
- 47 Stone Meadow Ln
- 44 Stone Meadow Ln
- 7 Boxberry Ln Unit 7
- 17 Pine Haven Cir
- 776 Main St
- 98 Myrtle St
- 575 Whiting St
- 594 Whiting St
- 605 Whiting St
- 578 Whiting St
- 565 Whiting St
- 23 Virginia Dr
- 564 Whiting St
- 22 Oldfield Dr
- 25 Virginia Dr
- 2 Woodruff Place
- 622 Whiting St
- 555 Whiting St
- 554 Whiting St
- 36 Oldfield Dr
- 545 Whiting St
- 1 Woodruff Place
- 570 Whiting St
- 542 Whiting St
- 76 Holly Berry Ln
- 634 Whiting St
Your Personal Tour Guide
Ask me questions while you tour the home.