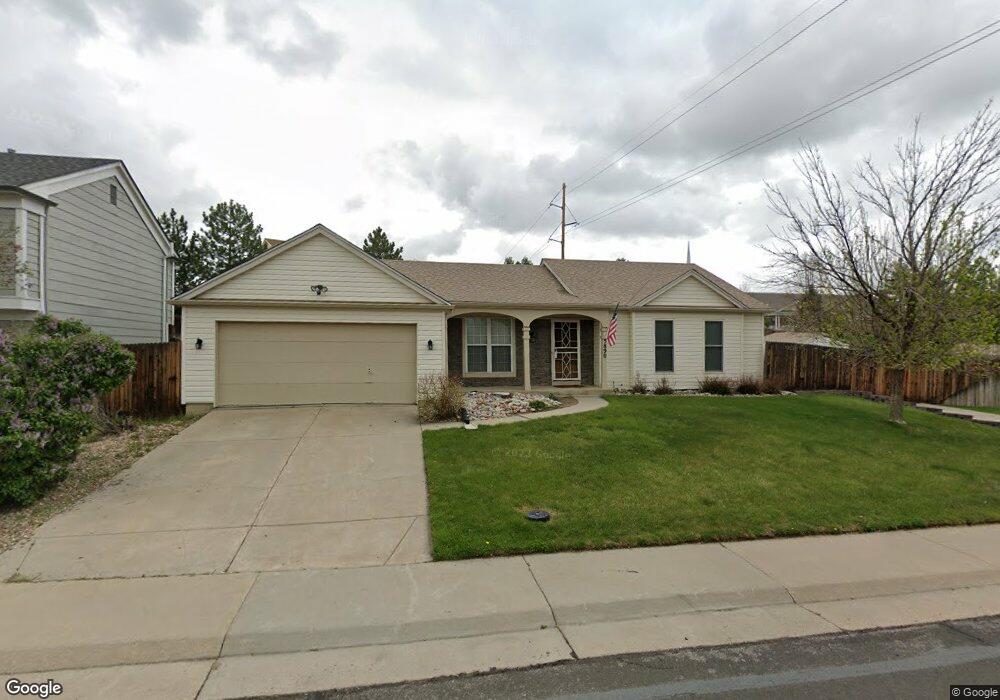
5890 S Perth Place Centennial, CO 80015
Park View NeighborhoodEstimated Value: $486,356 - $522,000
3
Beds
1
Bath
1,382
Sq Ft
$361/Sq Ft
Est. Value
About This Home
This home is located at 5890 S Perth Place, Centennial, CO 80015 and is currently estimated at $498,839, approximately $360 per square foot. 5890 S Perth Place is a home located in Arapahoe County with nearby schools including Canyon Creek Elementary School, Thunder Ridge Middle School, and Cherokee Trail High School.
Ownership History
Date
Name
Owned For
Owner Type
Purchase Details
Closed on
May 1, 2020
Sold by
Dozier Susan L and Dozier John A
Bought by
Dozier John A
Current Estimated Value
Purchase Details
Closed on
Mar 19, 2015
Sold by
Dozier John A
Bought by
Dozier John A and Dozier Susan L
Home Financials for this Owner
Home Financials are based on the most recent Mortgage that was taken out on this home.
Original Mortgage
$82,250
Interest Rate
3.82%
Mortgage Type
New Conventional
Purchase Details
Closed on
Feb 1, 1993
Sold by
Dozier John A and Beck Deborah L
Bought by
Dozier John A
Purchase Details
Closed on
Jul 31, 1986
Sold by
Conversion Arapco
Bought by
Dozier John A and Beck Deborah L
Purchase Details
Closed on
Feb 1, 1984
Sold by
Conversion Arapco
Bought by
Conversion Arapco
Purchase Details
Closed on
Jul 1, 1983
Bought by
Conversion Arapco
Create a Home Valuation Report for This Property
The Home Valuation Report is an in-depth analysis detailing your home's value as well as a comparison with similar homes in the area
Home Values in the Area
Average Home Value in this Area
Purchase History
| Date | Buyer | Sale Price | Title Company |
|---|---|---|---|
| Dozier John A | -- | None Available | |
| Dozier John A | -- | Fitco | |
| Dozier John A | -- | -- | |
| Dozier John A | -- | -- | |
| Conversion Arapco | -- | -- | |
| Conversion Arapco | -- | -- |
Source: Public Records
Mortgage History
| Date | Status | Borrower | Loan Amount |
|---|---|---|---|
| Closed | Dozier John A | $82,250 |
Source: Public Records
Tax History
| Year | Tax Paid | Tax Assessment Tax Assessment Total Assessment is a certain percentage of the fair market value that is determined by local assessors to be the total taxable value of land and additions on the property. | Land | Improvement |
|---|---|---|---|---|
| 2025 | $3,378 | $32,025 | -- | -- |
| 2024 | $3,008 | $31,376 | -- | -- |
| 2023 | $3,008 | $31,376 | $0 | $0 |
| 2022 | $2,536 | $24,895 | $0 | $0 |
| 2021 | $2,544 | $24,895 | $0 | $0 |
| 2020 | $2,426 | $24,167 | $0 | $0 |
| 2019 | $2,341 | $24,167 | $0 | $0 |
| 2018 | $2,105 | $19,325 | $0 | $0 |
| 2017 | $2,069 | $19,325 | $0 | $0 |
| 2016 | $2,010 | $17,814 | $0 | $0 |
| 2015 | $1,941 | $17,814 | $0 | $0 |
| 2014 | $1,501 | $12,330 | $0 | $0 |
| 2013 | -- | $13,560 | $0 | $0 |
Source: Public Records
Map
Nearby Homes
- 5839 S Perth Place
- 21550 E Alamo Place
- 5853 S Quemoy Cir
- 5915 S Nepal St
- 21268 E Powers Place
- 21238 E Powers Place
- 21631 E Crestridge Place
- 6101 S Shawnee St
- 5458 S Perth Way
- 22156 E Berry Place
- 5633 S Sicily Cir
- 22341 E Dorado Dr
- 22019 E Arbor Dr
- 5904 S Ukraine St
- 21417 E Crestridge Place
- 22370 E Dorado Ave
- 5503 S Malta St
- 22640 E Ida Cir
- 5716 S Lisbon Way
- 21903 E Crestline Ln
- 5880 S Perth Place
- 5845 S Quatar Cir
- 21692 E Alamo Place
- 5902 S Perth St
- 5851 S Quatar Cir
- 5841 S Quatar Cir
- 21672 E Alamo Place
- 5901 R S Perth St
- 5860 S Perth Place
- 5901 S Perth St
- 5869 S Perth Place
- 5912 S Perth St
- 5835 S Quatar Cir
- 5861 S Quatar Cir
- 5911 S Perth St
- 21652 E Alamo Place
- 5859 S Perth Place
- 5850 S Perth Place
- 5882 S Orleans Way
- 5831 S Quatar Cir
Your Personal Tour Guide
Ask me questions while you tour the home.