59-12 60th Ln Unit 3L Flushing, NY 11378
Maspeth NeighborhoodEstimated Value: $1,607,000 - $1,680,000
About This Home
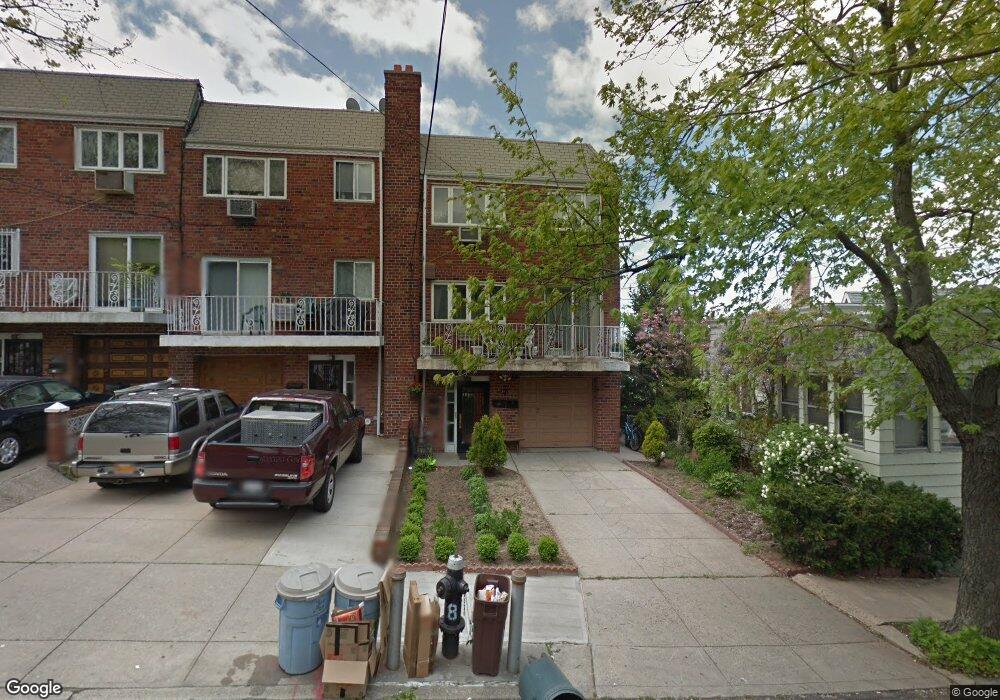
This home is located at 59-12 60th Ln Unit 3L, Flushing, NY 11378 and is currently estimated at $1,653,667, approximately $545 per square foot. 59-12 60th Ln Unit 3L is a home located in Queens County with nearby schools including P.S. 153 Maspeth, IS 73 - The Frank Sansivieri School, and Grover Cleveland High School.
Ownership History
We collect this data history from publicly available records. To have your information removed, we recommend requesting removal directly through your county’s website.
Purchase Details
Purchase Details
Purchase Details
Home Financials for this Owner
Home Financials are based on the most recent Mortgage that was taken out on this home.Home Values in the Area
Average Home Value in this Area
Purchase History
We collect this data history from publicly available records. To have your information removed, we recommend requesting removal directly through your county’s website.
| Date | Buyer | Sale Price | Title Company |
|---|---|---|---|
| -- | -- | ||
| -- | -- | ||
| -- | -- | ||
| -- | -- | ||
| -- | -- | ||
| -- | -- | ||
| -- | -- | ||
| -- | -- |
Mortgage History
We collect this data history from publicly available records. To have your information removed, we recommend requesting removal directly through your county’s website.
| Date | Status | Borrower | Loan Amount |
|---|---|---|---|
| Previous Owner | $1,885 |
Tax History
We collect this data history from publicly available records. To have your information removed, we recommend requesting removal directly through your county’s website.
| Year | Tax Paid | Tax Assessment Tax Assessment Total Assessment is a certain percentage of the fair market value that is determined by local assessors to be the total taxable value of land and additions on the property. | Land | Improvement |
|---|---|---|---|---|
| 2026 | $5,001 | $58,994 | $8,856 | $50,138 |
| 2025 | $10,218 | $57,954 | $10,463 | $47,491 |
| 2024 | $10,322 | $54,674 | $11,459 | $43,215 |
| 2023 | $9,597 | $51,581 | $9,445 | $42,136 |
| 2022 | $9,155 | $71,760 | $14,700 | $57,060 |
| 2021 | $9,687 | $69,780 | $14,700 | $55,080 |
| 2020 | $9,564 | $70,020 | $14,700 | $55,320 |
| 2019 | $5,060 | $77,160 | $14,700 | $62,460 |
| 2018 | $4,598 | $42,984 | $9,319 | $33,665 |
| 2017 | $8,052 | $40,968 | $10,337 | $30,631 |
| 2016 | $7,880 | $40,968 | $10,337 | $30,631 |
| 2015 | $4,442 | $40,247 | $11,232 | $29,015 |
| 2014 | $4,442 | $37,969 | $11,441 | $26,528 |
Map
- 58-29 60th Ln
- 58-22 60th Place
- 6062 Flushing Ave
- 6060 Flushing Ave
- 5918 60th St
- 58-62 Fresh Pond Rd
- 5940 Flushing Ave
- 5911 Fresh Pond Rd
- 60-14 60th Ave
- 5869 59th St
- 5912 58th Rd
- 5907 59th Dr
- 60-58 60th Rd
- 6236 59th Dr Unit B2
- 60-27 60th St
- 6019 60th Dr
- 57-22 63rd St
- 58-10 64th St
- 59-17 58th Ave
- 5801 59th St
Ask me questions while you tour the home.