Estimated Value: $253,667 - $428,000
4
Beds
2
Baths
2,401
Sq Ft
$152/Sq Ft
Est. Value
About This Home
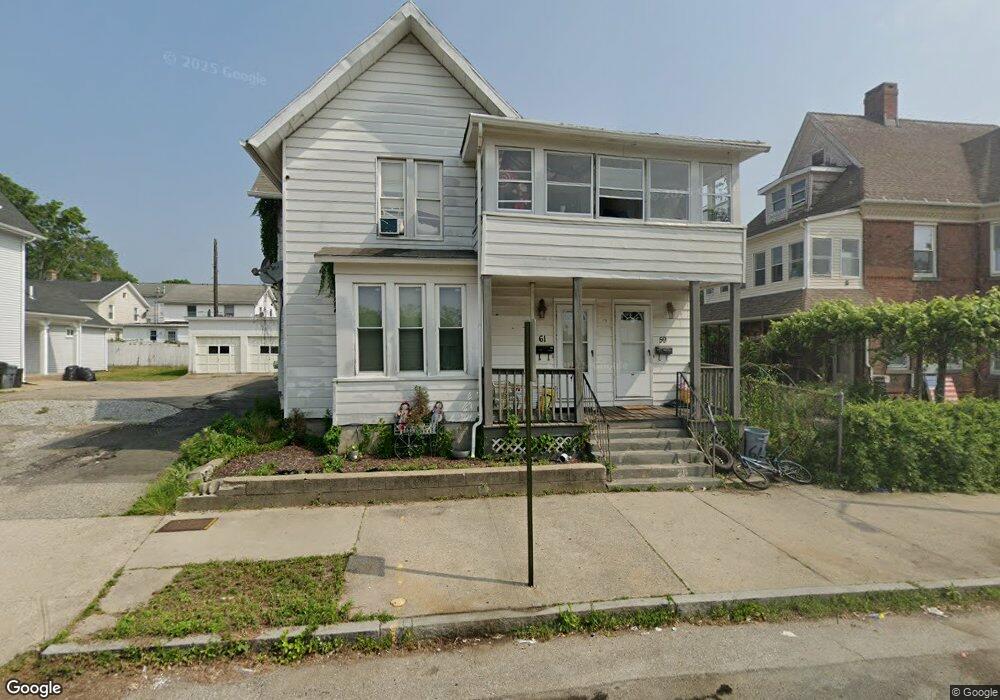
This home is located at 59 5th St Unit 61, Derby, CT 06418 and is currently estimated at $365,917, approximately $152 per square foot. 59 5th St Unit 61 is a home located in New Haven County with nearby schools including Derby Middle School, Derby High School, and St Mary & St Michael School.
Ownership History
Date
Name
Owned For
Owner Type
Purchase Details
Closed on
Apr 22, 2010
Sold by
Home Sales Inc
Bought by
Jubenville Alfred and Jubenville Charlene
Current Estimated Value
Purchase Details
Closed on
Jan 29, 2010
Sold by
Joseph Paulette
Bought by
Jp Morgan Chase Bk
Purchase Details
Closed on
Jul 30, 2009
Sold by
Joseph Paulette
Bought by
Jp Morgan Chase Bk
Purchase Details
Closed on
Oct 31, 2005
Sold by
Skobodinski Arthur
Bought by
Joseph Paulette
Home Financials for this Owner
Home Financials are based on the most recent Mortgage that was taken out on this home.
Original Mortgage
$149,200
Interest Rate
5.79%
Purchase Details
Closed on
Feb 28, 1997
Sold by
Santiago Raul and Santiago Tina N
Bought by
Skobodzinski Artur and Asasouk Vanessa P
Purchase Details
Closed on
Jun 21, 1995
Sold by
Fhlmc
Bought by
Santiago Tina N and Santiago Raul
Create a Home Valuation Report for This Property
The Home Valuation Report is an in-depth analysis detailing your home's value as well as a comparison with similar homes in the area
Home Values in the Area
Average Home Value in this Area
Purchase History
| Date | Buyer | Sale Price | Title Company |
|---|---|---|---|
| Jubenville Alfred | $69,200 | -- | |
| Homesales Inc | -- | -- | |
| Jp Morgan Chase Bk | -- | -- | |
| Jp Morgan Chase Bk | -- | -- | |
| Joseph Paulette | $186,500 | -- | |
| Skobodzinski Artur | $71,000 | -- | |
| Santiago Tina N | $59,500 | -- |
Source: Public Records
Mortgage History
| Date | Status | Borrower | Loan Amount |
|---|---|---|---|
| Previous Owner | Santiago Tina N | $212,500 | |
| Previous Owner | Santiago Tina N | $149,200 |
Source: Public Records
Tax History Compared to Growth
Tax History
| Year | Tax Paid | Tax Assessment Tax Assessment Total Assessment is a certain percentage of the fair market value that is determined by local assessors to be the total taxable value of land and additions on the property. | Land | Improvement |
|---|---|---|---|---|
| 2025 | $4,603 | $106,540 | $18,940 | $87,600 |
| 2024 | $4,603 | $106,540 | $18,970 | $87,570 |
| 2023 | $4,112 | $106,540 | $18,970 | $87,570 |
| 2022 | $4,112 | $106,540 | $18,970 | $87,570 |
| 2021 | $4,112 | $106,540 | $18,970 | $87,570 |
| 2020 | $3,528 | $80,430 | $18,970 | $61,460 |
| 2019 | $3,368 | $80,430 | $18,970 | $61,460 |
| 2018 | $3,167 | $80,430 | $18,970 | $61,460 |
| 2017 | $3,167 | $80,430 | $18,970 | $61,460 |
| 2016 | $3,167 | $80,430 | $18,970 | $61,460 |
| 2015 | $3,227 | $90,300 | $24,010 | $66,290 |
| 2014 | $3,227 | $90,300 | $24,010 | $66,290 |
Source: Public Records
Map
Nearby Homes
- 44 Lafayette St
- 105 Camptown St
- 63 Minerva St
- 255 Canal St E
- 98 Water St
- 18 Brook St
- 145 Canal St Unit 203
- 145 Canal St Unit 10
- 145 Canal St Unit 118
- 145 Canal St Unit 312
- 120 Smith St
- 196 Hawkins St
- 69 Seymour Ave
- 154 Hawthorne Ave
- 16 Union St
- 125 Oak Ave
- 194 Smith St
- 88 Summit St Unit 88
- 760 Howe Ave Unit 762
- 233 Derby Ave Unit 611
- 34 Anson St
- 75 5th St
- 42 Anson St
- 63 5th St
- 10 Lafayette St
- 10 Lafayette St Unit 7*
- 12 Lafayette St
- 30 Lafayette St Unit 32
- 31 Anson St Unit 13
- 31 Anson St
- 16 Lafayette St
- 16 Lafayette St Unit 2nd
- 51 5th St
- 65 5th St
- 65 5th St Unit 1
- 41 Anson St
- 24 Lafayette St Unit 26
- 23 Anson St
- 58 Anson St Unit 2B
- 58 Anson St Unit 3R