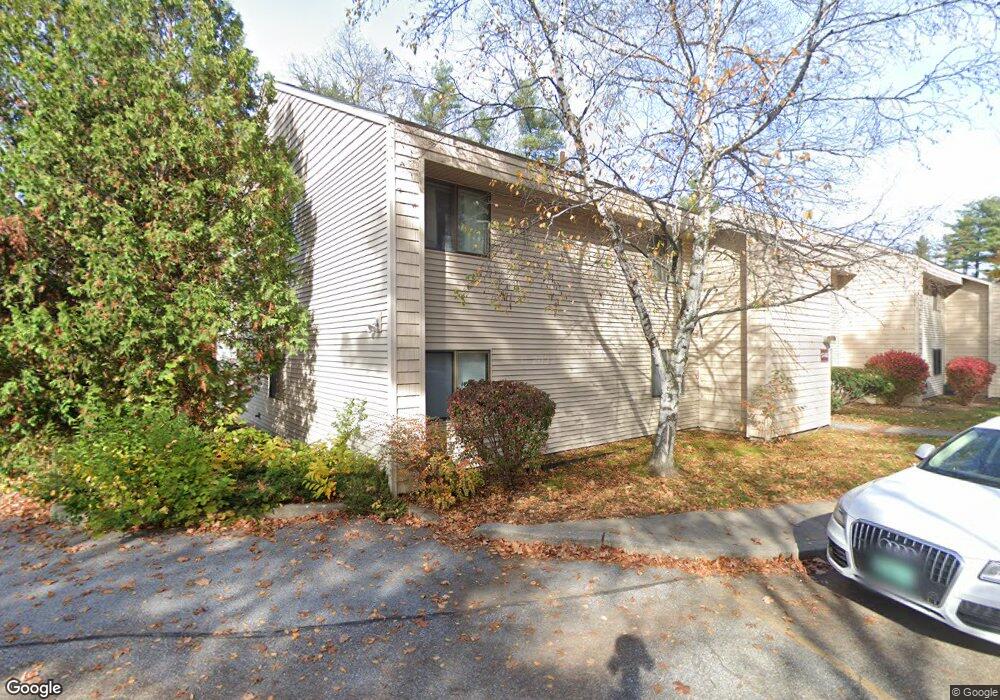
59 Bayberry Ln South Burlington, VT 05403
Estimated Value: $204,887 - $295,000
2
Beds
1
Bath
1,476
Sq Ft
$176/Sq Ft
Est. Value
About This Home
This home is located at 59 Bayberry Ln, South Burlington, VT 05403 and is currently estimated at $260,296, approximately $176 per square foot. 59 Bayberry Ln is a home located in Chittenden County with nearby schools including Frederick H. Tuttle Middle School, South Burlington High School, and The Bellwether School.
Ownership History
Date
Name
Owned For
Owner Type
Purchase Details
Closed on
Jul 11, 2023
Sold by
Lin Wei K and Yokoyama Kyoko
Bought by
Champlain Housing Trust Inc
Current Estimated Value
Purchase Details
Closed on
Jun 19, 2015
Sold by
Champlain Housing Trust Inc
Bought by
Lin Wei and Yokoyama Kyoko
Purchase Details
Closed on
Jun 5, 2015
Sold by
Lin Guo Reng and Lin Hui Xian
Bought by
Champlain Housing Trust Inc
Purchase Details
Closed on
May 26, 2000
Sold by
Sirotkin Jack B Rev Liv Tr
Bought by
Barrett Brett
Purchase Details
Closed on
Aug 22, 1997
Sold by
Sirotkin Jack B
Bought by
Sirotkin Jack B Trust
Purchase Details
Closed on
May 10, 1990
Sold by
Surles Richard D
Bought by
Greaves Susan E
Create a Home Valuation Report for This Property
The Home Valuation Report is an in-depth analysis detailing your home's value as well as a comparison with similar homes in the area
Home Values in the Area
Average Home Value in this Area
Purchase History
| Date | Buyer | Sale Price | Title Company |
|---|---|---|---|
| Champlain Housing Trust Inc | $137,250 | -- | |
| Champlain Housing Trust Inc | $137,250 | -- | |
| Anderson Leah | $260,000 | -- | |
| Anderson Leah | $260,000 | -- | |
| Champlain Housing Trust Inc | $137,250 | -- | |
| Lin Wei | $160,000 | -- | |
| Lin Wei | $160,000 | -- | |
| Champlain Housing Trust Inc | $111,500 | -- | |
| Champlain Housing Trust Inc | $111,500 | -- | |
| Barrett Brett | $83,400 | -- | |
| Sirotkin Jack B Trust | -- | -- | |
| Greaves Susan E | $89,900 | -- |
Source: Public Records
Tax History Compared to Growth
Tax History
| Year | Tax Paid | Tax Assessment Tax Assessment Total Assessment is a certain percentage of the fair market value that is determined by local assessors to be the total taxable value of land and additions on the property. | Land | Improvement |
|---|---|---|---|---|
| 2024 | $3,058 | $138,800 | $0 | $138,800 |
| 2023 | $2,662 | $138,800 | $0 | $138,800 |
| 2022 | $2,445 | $138,800 | $0 | $138,800 |
| 2021 | $2,443 | $138,800 | $0 | $138,800 |
| 2020 | $2,373 | $120,750 | $0 | $120,750 |
| 2019 | $2,719 | $120,750 | $0 | $120,750 |
| 2018 | $2,633 | $120,750 | $0 | $120,750 |
| 2017 | $2,137 | $120,750 | $0 | $120,750 |
| 2016 | $1,460 | $120,750 | $0 | $120,750 |
Source: Public Records
Map
Nearby Homes
- 64 Hawthorne Cir
- 30 Bayberry Ln
- 85 Bayberry Ln
- 17 Hawthorne Cir
- 107 Sugar Tree Ln
- 341 O'Brien Farm Rd
- 213 Leo Ln
- 445 Old Farm Rd
- 437 Old Farm Rd
- 297 Old Farm Rd
- 49 Daniel Dr
- 136 Two Brothers Dr
- 41 Winding Brook Dr
- 45 Winding Brook Dr
- 196 Mabel Way
- 6 Mayfair St
- 160 Mabel Way
- 98 Logwood St
- 82 Winding Brook Dr
- 34 Mabel Way
- 57 Bayberry Ln
- 58 Bayberry Ln
- 55 Bayberry Ln
- 56 Bayberry Ln
- 54 Bayberry Ln
- 53 Bayberry Ln
- 52 Bayberry Ln
- 51 Bayberry Ln
- 49 Bayberry Ln Unit 49
- 50 Bayberry Ln
- 61 Bayberry Ln
- 62 Bayberry Ln
- 63 Bayberry Ln
- 64 Bayberry Ln
- 48 Bayberry Ln
- 47 Bayberry Ln
- 46 Bayberry Ln
- 67 Bayberry Ln
- 65 Bayberry Ln
- 45 Bayberry Ln