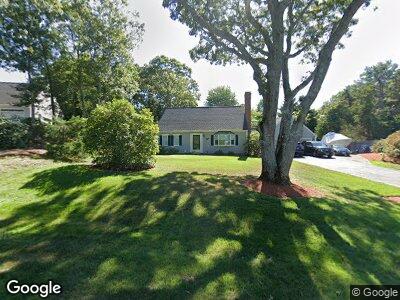
59 Bradford Rd South Dennis, MA 02660
East Dennis NeighborhoodEstimated Value: $878,145 - $954,000
4
Beds
3
Baths
1,960
Sq Ft
$465/Sq Ft
Est. Value
About This Home
This home is located at 59 Bradford Rd, South Dennis, MA 02660 and is currently estimated at $911,786, approximately $465 per square foot. 59 Bradford Rd is a home located in Barnstable County with nearby schools including Dennis-Yarmouth Regional High School and Latham School.
Ownership History
Date
Name
Owned For
Owner Type
Purchase Details
Closed on
Jun 5, 2019
Sold by
Stjohn David G
Bought by
Stjohn Ft
Current Estimated Value
Purchase Details
Closed on
Jan 13, 2000
Sold by
Roessel Brian D and Roessel Nancy J
Bought by
Stjohn David G and Saint John Linda J
Home Financials for this Owner
Home Financials are based on the most recent Mortgage that was taken out on this home.
Original Mortgage
$80,000
Interest Rate
7.79%
Mortgage Type
Purchase Money Mortgage
Create a Home Valuation Report for This Property
The Home Valuation Report is an in-depth analysis detailing your home's value as well as a comparison with similar homes in the area
Home Values in the Area
Average Home Value in this Area
Purchase History
| Date | Buyer | Sale Price | Title Company |
|---|---|---|---|
| Stjohn Ft | -- | -- | |
| Stjohn David G | $80,000 | -- |
Source: Public Records
Mortgage History
| Date | Status | Borrower | Loan Amount |
|---|---|---|---|
| Previous Owner | Stjohn David G | $80,000 |
Source: Public Records
Tax History Compared to Growth
Tax History
| Year | Tax Paid | Tax Assessment Tax Assessment Total Assessment is a certain percentage of the fair market value that is determined by local assessors to be the total taxable value of land and additions on the property. | Land | Improvement |
|---|---|---|---|---|
| 2025 | $3,811 | $880,100 | $197,100 | $683,000 |
| 2024 | $3,722 | $847,800 | $189,500 | $658,300 |
| 2023 | $3,600 | $770,900 | $172,300 | $598,600 |
| 2022 | $3,355 | $599,100 | $155,200 | $443,900 |
| 2021 | $3,232 | $536,000 | $152,200 | $383,800 |
| 2020 | $3,135 | $513,900 | $152,200 | $361,700 |
| 2019 | $2,993 | $485,100 | $162,800 | $322,300 |
| 2018 | $2,910 | $459,000 | $154,900 | $304,100 |
| 2017 | $2,744 | $446,100 | $142,000 | $304,100 |
| 2016 | $2,728 | $417,800 | $161,400 | $256,400 |
| 2015 | $2,594 | $405,300 | $161,400 | $243,900 |
| 2014 | $2,402 | $378,200 | $142,000 | $236,200 |
Source: Public Records
Map
Nearby Homes
- 41 High Head Rd
- 1 Old Salt Ln
- 1348 Massachusetts 134
- 153 Sesuit Neck Rd
- 1376 Bridge St Unit 16
- 12 Paddocks Path
- 136 Forest Pines Dr
- 1263 Massachusetts 134
- 154 Forest Hills Dr
- 53 Settlers Ln
- 18 Wendy Way
- 10 Shiverick Rd
- 43 Stony Way
- 77 Cedar Hill Rd
- 43 Stony Way
- 47 Scargo Hill Rd
- 11 Scargo Hill Rd
- 32 Captain Walsh Dr
- 31 Acorn Rd
- 831 Main St