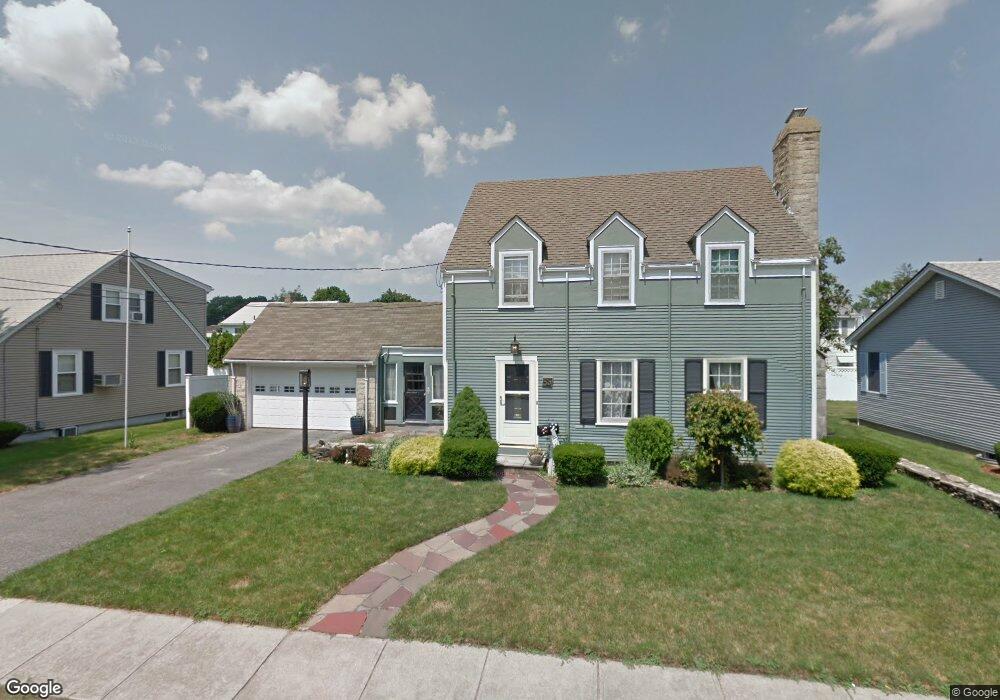
59 Bryant Rd Cranston, RI 02910
Eden Park NeighborhoodEstimated Value: $423,384 - $476,000
3
Beds
2
Baths
1,513
Sq Ft
$298/Sq Ft
Est. Value
About This Home
This home is located at 59 Bryant Rd, Cranston, RI 02910 and is currently estimated at $451,346, approximately $298 per square foot. 59 Bryant Rd is a home located in Providence County with nearby schools including Park View Middle School, Cranston High School East, and Cadence Academy Preschool - Cranston.
Ownership History
Date
Name
Owned For
Owner Type
Purchase Details
Closed on
Mar 28, 2005
Sold by
Threlfall Kent and Culgin Larson
Bought by
Nawrocki Richard T and Torino Beth A
Current Estimated Value
Home Financials for this Owner
Home Financials are based on the most recent Mortgage that was taken out on this home.
Original Mortgage
$212,000
Interest Rate
5.56%
Mortgage Type
Purchase Money Mortgage
Create a Home Valuation Report for This Property
The Home Valuation Report is an in-depth analysis detailing your home's value as well as a comparison with similar homes in the area
Home Values in the Area
Average Home Value in this Area
Purchase History
| Date | Buyer | Sale Price | Title Company |
|---|---|---|---|
| Nawrocki Richard T | $265,000 | -- |
Source: Public Records
Mortgage History
| Date | Status | Borrower | Loan Amount |
|---|---|---|---|
| Open | Nawrocki Richard T | $191,000 | |
| Closed | Nawrocki Richard T | $217,402 | |
| Closed | Nawrocki Richard T | $212,000 | |
| Closed | Nawrocki Richard T | $23,000 |
Source: Public Records
Tax History
| Year | Tax Paid | Tax Assessment Tax Assessment Total Assessment is a certain percentage of the fair market value that is determined by local assessors to be the total taxable value of land and additions on the property. | Land | Improvement |
|---|---|---|---|---|
| 2025 | $5,004 | $360,500 | $108,500 | $252,000 |
| 2024 | $4,906 | $360,500 | $108,500 | $252,000 |
| 2023 | $4,984 | $263,700 | $71,400 | $192,300 |
| 2022 | $4,881 | $263,700 | $71,400 | $192,300 |
| 2021 | $4,747 | $263,700 | $71,400 | $192,300 |
| 2020 | $4,613 | $222,100 | $68,000 | $154,100 |
| 2019 | $4,613 | $222,100 | $68,000 | $154,100 |
| 2018 | $4,506 | $222,100 | $68,000 | $154,100 |
| 2017 | $4,661 | $203,200 | $61,200 | $142,000 |
| 2016 | $4,562 | $203,200 | $61,200 | $142,000 |
| 2015 | $4,562 | $203,200 | $61,200 | $142,000 |
| 2014 | $4,340 | $190,000 | $61,200 | $128,800 |
Source: Public Records
Map
Nearby Homes
Your Personal Tour Guide
Ask me questions while you tour the home.