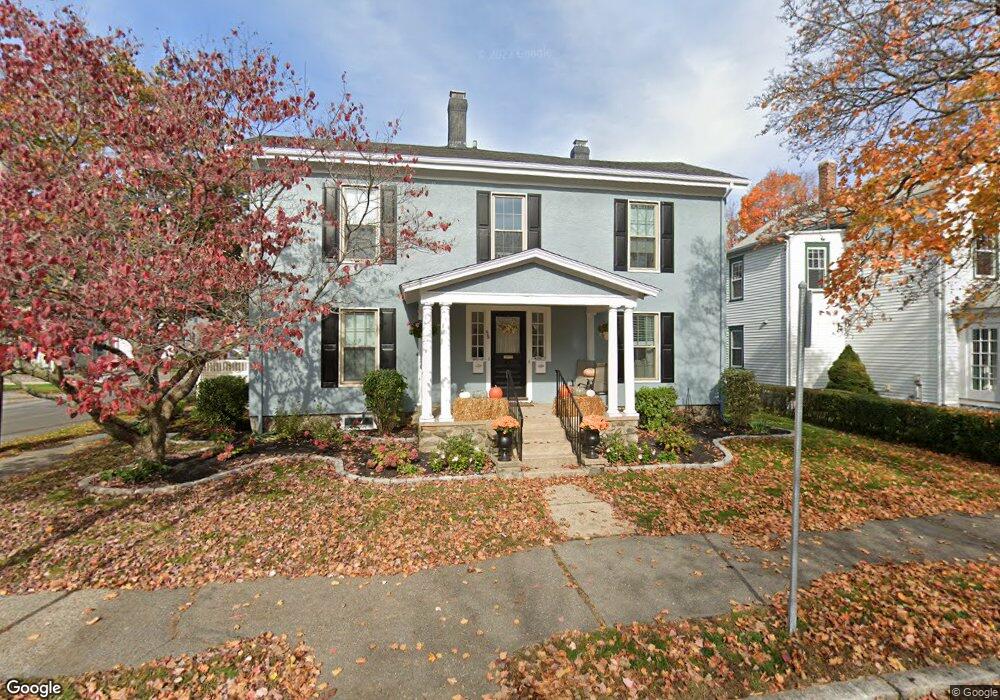
59 Chestnut St Unit 1 Wakefield, MA 01880
West Side NeighborhoodEstimated Value: $843,354 - $946,000
2
Beds
1
Bath
1,200
Sq Ft
$743/Sq Ft
Est. Value
About This Home
This home is located at 59 Chestnut St Unit 1, Wakefield, MA 01880 and is currently estimated at $891,839, approximately $743 per square foot. 59 Chestnut St Unit 1 is a home located in Middlesex County with nearby schools including Wakefield Memorial High School, St Joseph School, and St. Patrick Elementary School.
Ownership History
Date
Name
Owned For
Owner Type
Purchase Details
Closed on
Jan 31, 2019
Sold by
Chetwynd Joan G
Bought by
Joan G Chetwynd Irt and Collard
Current Estimated Value
Create a Home Valuation Report for This Property
The Home Valuation Report is an in-depth analysis detailing your home's value as well as a comparison with similar homes in the area
Home Values in the Area
Average Home Value in this Area
Purchase History
| Date | Buyer | Sale Price | Title Company |
|---|---|---|---|
| Joan G Chetwynd Irt | -- | -- |
Source: Public Records
Tax History Compared to Growth
Tax History
| Year | Tax Paid | Tax Assessment Tax Assessment Total Assessment is a certain percentage of the fair market value that is determined by local assessors to be the total taxable value of land and additions on the property. | Land | Improvement |
|---|---|---|---|---|
| 2025 | $7,955 | $700,900 | $335,100 | $365,800 |
| 2024 | $7,840 | $696,900 | $333,200 | $363,700 |
| 2023 | $7,459 | $635,900 | $303,800 | $332,100 |
| 2022 | $7,141 | $579,600 | $276,700 | $302,900 |
| 2021 | $6,846 | $537,800 | $257,900 | $279,900 |
| 2020 | $6,419 | $502,700 | $241,100 | $261,600 |
| 2019 | $6,134 | $478,100 | $229,300 | $248,800 |
| 2018 | $5,712 | $441,100 | $211,500 | $229,600 |
| 2017 | $5,371 | $412,200 | $197,600 | $214,600 |
| 2016 | $5,045 | $374,000 | $187,000 | $187,000 |
| 2015 | $4,714 | $349,700 | $174,700 | $175,000 |
| 2014 | $4,300 | $336,500 | $168,000 | $168,500 |
Source: Public Records
Map
Nearby Homes
- 34 Cedar St
- 6 Avon Ct Unit 2
- 47 Emerson St
- 46 Yale Ave
- 46 Church St Unit 2
- 66 Gould St
- 5 Byron St
- Unit 406 Plan at Wrenly
- Unit 208 Plan at Wrenly
- Unit 312 Plan at Wrenly
- Unit 313 Plan at Wrenly
- Unit 310 Plan at Wrenly
- 62 Foundry St Unit 310
- 62 Foundry St Unit 312
- 62 Foundry St Unit 506
- 62 Foundry St Unit 413
- 62 Foundry St Unit 208
- 62 Foundry St Unit 414
- 62 Foundry St Unit 406
- 62 Foundry St Unit 313
- 59 Chestnut St
- 57 Chestnut St
- 44 Cedar St
- 61-63 Chestnut St
- 61-63 Chestnut St Unit 63A
- 61-63 Chestnut St Unit 61
- 61-63 Chestnut St Unit 1
- 62 Chestnut St
- 40 Cedar St
- 43 Cedar St
- 60 Chestnut St
- 55 Chestnut St
- 41 Cedar St
- 2 Cedar Place
- 64 Chestnut St
- 64 Chestnut St Unit 2
- 65 Chestnut St Unit 2
- 65 Chestnut St Unit 1
- 65 Chestnut St
- 39 Cedar St