59 Conselyea St Unit A3 Brooklyn, NY 11211
Williamsburg NeighborhoodEstimated Value: $1,198,000 - $2,203,000
About This Home
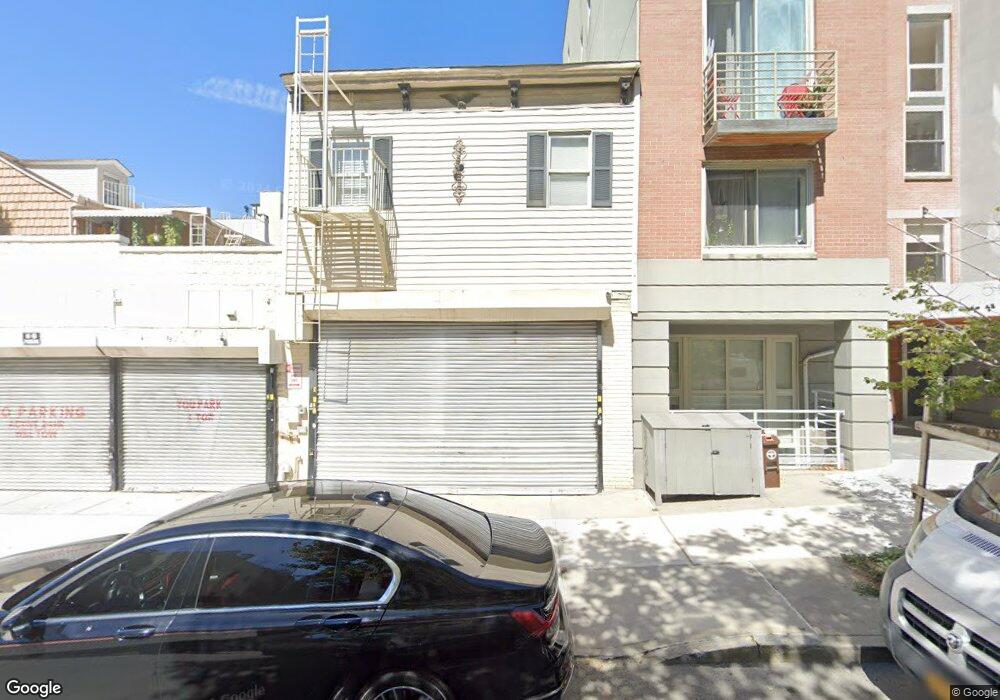
This home is located at 59 Conselyea St Unit A3, Brooklyn, NY 11211 and is currently estimated at $1,600,667, approximately $1,650 per square foot. 59 Conselyea St Unit A3 is a home located in Kings County with nearby schools including P.S. 132 The Conselyea School, Success Academy Charter School-NYC 9, and Northside Charter High School.
Ownership History
We collect this data history from publicly available records. To have your information removed, we recommend requesting removal directly through your county’s website.
Purchase Details
Home Financials for this Owner
Home Financials are based on the most recent Mortgage that was taken out on this home.Purchase Details
Home Financials for this Owner
Home Financials are based on the most recent Mortgage that was taken out on this home.Purchase Details
Home Values in the Area
Average Home Value in this Area
Purchase History
We collect this data history from publicly available records. To have your information removed, we recommend requesting removal directly through your county’s website.
| Date | Buyer | Sale Price | Title Company |
|---|---|---|---|
| $1,140,000 | -- | ||
| $1,140,000 | -- | ||
| $1,140,000 | -- | ||
| -- | -- | ||
| -- | -- | ||
| $656,771 | -- | ||
| $656,771 | -- |
Mortgage History
We collect this data history from publicly available records. To have your information removed, we recommend requesting removal directly through your county’s website.
| Date | Status | Borrower | Loan Amount |
|---|---|---|---|
| Open | $912,000 | ||
| Closed | $912,000 | ||
| Previous Owner | $11,601 |
Tax History
We collect this data history from publicly available records. To have your information removed, we recommend requesting removal directly through your county’s website.
| Year | Tax Paid | Tax Assessment Tax Assessment Total Assessment is a certain percentage of the fair market value that is determined by local assessors to be the total taxable value of land and additions on the property. | Land | Improvement |
|---|---|---|---|---|
| 2026 | $8,603 | $78,225 | $5,076 | $73,149 |
| 2025 | $8,342 | $72,732 | $5,076 | $67,656 |
| 2024 | $8,342 | $70,821 | $5,076 | $65,745 |
| 2023 | $7,582 | $61,804 | $5,076 | $56,728 |
| 2022 | $6,393 | $82,405 | $5,076 | $77,329 |
| 2021 | $4,252 | $56,370 | $5,076 | $51,294 |
| 2020 | $1,498 | $62,580 | $5,076 | $57,504 |
| 2019 | $1,617 | $62,580 | $5,076 | $57,504 |
| 2018 | $266 | $60,370 | $5,075 | $55,295 |
| 2017 | $266 | $53,861 | $5,075 | $48,786 |
| 2016 | $269 | $55,832 | $5,076 | $50,756 |
| 2015 | $211 | $46,039 | $5,075 | $40,964 |
| 2014 | $211 | $41,262 | $5,075 | $36,187 |
Map
- 72 Conselyea St
- 605 Lorimer St Unit 3-R
- 605 Lorimer St Unit 4-R
- 605 Lorimer St Unit 4-F
- 605 Lorimer St Unit 3-F
- 605 Lorimer St Unit 2-F
- 636 Lorimer St Unit TWNHS
- 74 Jackson St Unit 4
- 33 Conselyea St Unit PH
- 30 Skillman Ave Unit 2-R
- 30 Skillman Ave Unit 3-R
- 30 Skillman Ave Unit 2-F
- 30 Skillman Ave Unit 4-F
- 30 Skillman Ave Unit 3-F
- 21 Conselyea St Unit 2
- 357 Leonard St Unit GARDEN
- 357 Leonard St Unit 2-R
- 357 Leonard St Unit 2-F
- 550 Metropolitan Ave Unit PHA
- 88 Withers St Unit 4A
- 63 Conselyea St Unit 3B
- 63 Conselyea St Unit R1
- 63 Conselyea St Unit B4
- 63 Conselyea St Unit B3
- 63 Conselyea St Unit A3
- 63 Conselyea St Unit B2
- 63 Conselyea St Unit A2
- 63 Conselyea St Unit B1
- 63 Conselyea St Unit A1
- 63 Conselyea St
- 63 Conselyea St Unit R2
- 63 Conselyea St Unit R4
- 63 Conselyea St Unit R3
- 61 Conselyea St Unit R1
- 61 Conselyea St Unit B4
- 61 Conselyea St Unit B3
- 61 Conselyea St Unit A3
- 61 Conselyea St Unit B2
- 61 Conselyea St Unit A2
- 61 Conselyea St Unit B1
Ask me questions while you tour the home.