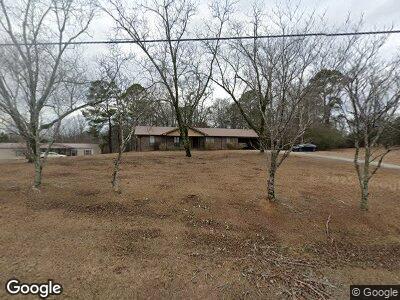
59 Cordova Gorgas Rd Cordova, AL 35550
Estimated Value: $160,000 - $211,000
--
Bed
--
Bath
2,156
Sq Ft
$88/Sq Ft
Est. Value
About This Home
This home is located at 59 Cordova Gorgas Rd, Cordova, AL 35550 and is currently estimated at $190,421, approximately $88 per square foot. 59 Cordova Gorgas Rd is a home located in Walker County.
Ownership History
Date
Name
Owned For
Owner Type
Purchase Details
Closed on
Sep 22, 2006
Sold by
Stacks Lennie Sue Suzy and Stacks Gary Michael
Bought by
Stacks Gary Michael and Stacks Ginger Lacy
Current Estimated Value
Create a Home Valuation Report for This Property
The Home Valuation Report is an in-depth analysis detailing your home's value as well as a comparison with similar homes in the area
Home Values in the Area
Average Home Value in this Area
Purchase History
| Date | Buyer | Sale Price | Title Company |
|---|---|---|---|
| Stacks Gary Michael | -- | -- |
Source: Public Records
Mortgage History
| Date | Status | Borrower | Loan Amount |
|---|---|---|---|
| Closed | Stacks Gary Michael | $0 |
Source: Public Records
Tax History Compared to Growth
Tax History
| Year | Tax Paid | Tax Assessment Tax Assessment Total Assessment is a certain percentage of the fair market value that is determined by local assessors to be the total taxable value of land and additions on the property. | Land | Improvement |
|---|---|---|---|---|
| 2024 | $424 | $18,330 | $900 | $17,430 |
| 2023 | $424 | $18,330 | $900 | $17,430 |
| 2022 | $392 | $17,080 | $750 | $16,330 |
| 2021 | $351 | $15,458 | $750 | $14,708 |
| 2020 | $351 | $15,480 | $760 | $14,720 |
| 2019 | $381 | $15,480 | $760 | $14,720 |
| 2018 | $334 | $14,840 | $760 | $14,080 |
| 2017 | $334 | $14,840 | $760 | $14,080 |
| 2016 | $344 | $15,220 | $760 | $14,460 |
| 2015 | $344 | $15,220 | $760 | $14,460 |
| 2014 | $335 | $14,880 | $700 | $14,180 |
| 2013 | $325 | $13,480 | $700 | $12,780 |
Source: Public Records
Map
Nearby Homes
- 1663 Cordova Gorgas Rd
- 00 Granny Hyche Rd
- 0 Reed Rd
- 2661 Underwood Ferry Rd
- 0 Columbus Blvd
- 307 Amory Ave
- 452 Green Ave
- 0 Underwood Ferry Rd Unit 24-2322
- 84 Warrior Ave
- 102 Warrior Ave
- 294 Highland Ave
- 123 Randy St
- 490 Reservoir St
- 95 Nation St
- 189 Vining Rd
- 0 4 Lots St
- 68 Buttercup Ln
- 515 River Dr
- 0 Pine Ln
- 0 River Front Dr